
NEW
Font size
S
M
L
XL
 Worksheets
Equation Line of Best Fits
Total questions: 20
Worksheet time: 37mins
Name
Class
Date
1.

What is the type of correlation?
a)
Negative
b)
no association
c)
positive
2.

What type of correlation does this graph have?
a)
positive
b)
negative
c)
none
d)
all of the above
3.

What type of correlation does this graph have?
a)
positive
b)
negative
c)
none
d)
all of the above
4.

What type of correlation does this scatter plot show?
a)
positive linear association
b)
negative linear association
c)
no association
d)
nonlinear association
5.
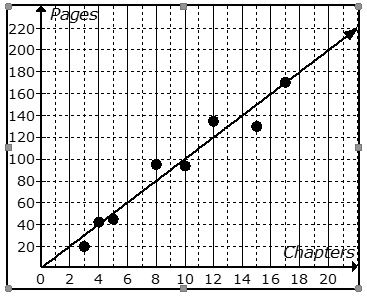
The scatter plot shows the relationship between the number of chapters and the total number of pages for several books. Use the trend line to predict how many chapters would be in a book with 140 pages.
a)
12 chapters
b)
19 chapters
c)
14 chapters
d)
21 chapters
6.
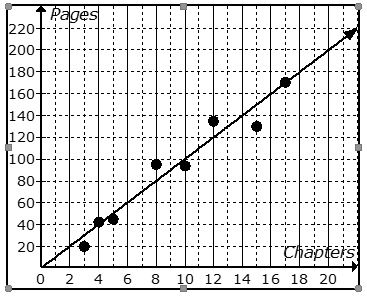
The scatter plot shows the relationship between the number of chapters and the total number of pages for several books. Use the trend line to predict how many pages would be in a book with 6 chapters.
a)
100 pages
b)
170 pages
c)
60 pages
d)
20 pages
7.
As x increases, y decreases.
a)
no correlation
b)
negative correlation
c)
correlation coefficient
d)
positive correlation
8.
What is a scatter plot?
a)
A graph that shows the relationship of two data sets.
b)
A graph drawn using rectangular bars to show how large each value is.
c)
A graph that shows information that is connected in some way.
d)
A graph that shows data changing over time.
9.

Which scatter plot shows a linear relationship between x and y?
a)
Graph A
b)
Graph B
c)
Graph C
d)
Graph D
10.
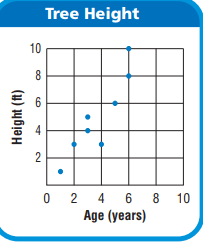
How many trees are 3 years old?
a)
1
b)
2
c)
0
d)
3
11.

If a squirrel climbs to the top of each tree that is 6 years old, how far has the squirrel climbed?
a)
2 ft
b)
18 ft
c)
10 ft
d)
11 ft
12.

What is the equation of the line of best fit?
a)
y = 3/2x
b)
y = 30x
c)
y = 30x + 300
d)
y = 3/2x + 300
13.

Which of the following lines represents the line of best fit for the scatter plot?
a)
A
b)
B
c)
C
d)
D
14.
What the y-intercept for the line of best fit for the scatter plot?
a)
35
b)
50
c)
30
d)
20
15.

Find the slope
a)
-5/7
b)
7/5
c)
-7/5
d)
5/7
16.
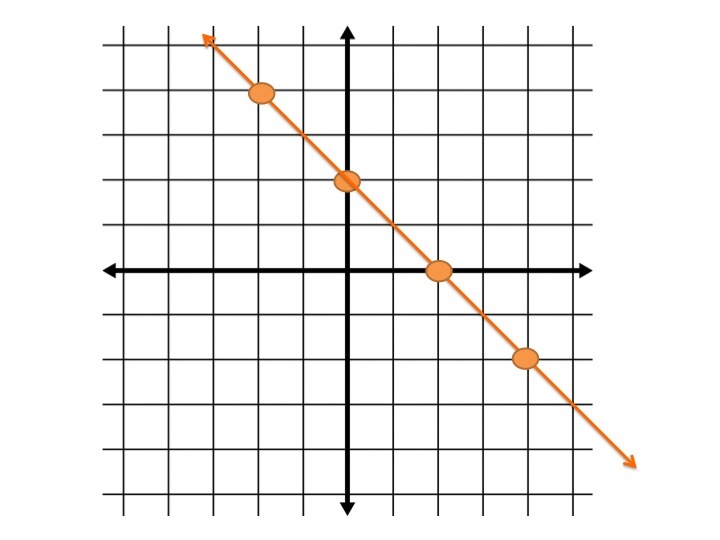
What is the equation of this line?
a)
y = 2x +2
b)
y = 2x -2
c)
y = -x + 2
d)
Cannot be Determined
17.
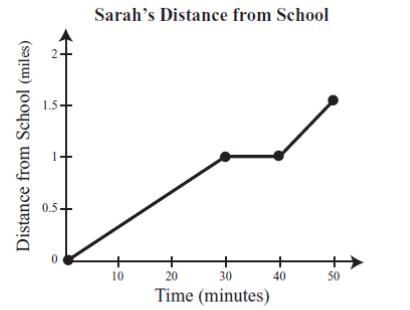
What is happening in the graph between 30 and 40 minutes?
a)
Sarah is accelerating
b)
Sarah is not moving
c)
Sarah is slowing down
d)
Sarah is travelling at a constant speed
18.
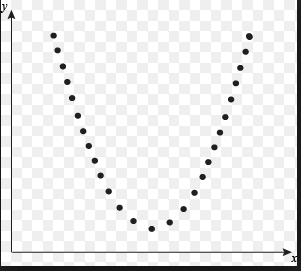
What type of association does this scatter plot represent?
a)
positive linear association
b)
negative association
c)
no association
d)
nonlinear association
19.

If m=3 and b=6, what is the correct slope intercept equation?
a)
y=3-6
b)
y=3x-6
c)
y=3x+6
d)
y=6x+3
20.

Which of the following could be a possible line of best fit for the data?
a)
y = -5/2x + 20
b)
y = -x + 19
c)
y = x + 20
d)
y = 2/3x + 15
Reset

