
Font size
 Worksheets
2.1
Total questions: 54
Worksheet time: 2hrs 20mins
The rate of change of velocity is called:
Distance
Acceleration
Speed
Displacement
When speed and direction of motion of a body do not change then the body will have:
Uniform velocity
Uniform acceleration
Negative velocity
Negative acceleration
The distance covered by a moving object per unit time is called:
Velocity
Acceleration
Speed
Displacement
Can an object's average velocity equal zero when object's speed is greater than zero?
Yes, when the object moves in a straight line at a constant rate.
Yes, when the object returns to its original position.
No, it is impossible because they are always equal
No, it is impossible because the magnitude of the velocity is always greater than speed.
A ball which has been dropped vertically downward on to the floor rebounds upward. Which of the following graph shows the variation of velocity with time?


An object is moving with a uniform acceleration of 5 m s-2. A graph of displacement against time shows the motion of this object having a gradient which
increases with time.
decreases with time
remain constant with time

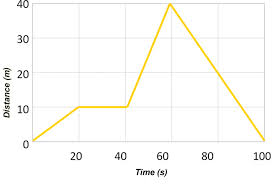
At 100 seconds, how much distance had this object traveled?
0 m
10 m
40 m
80 m

A car is traveling south for 250 meters over the course of 100 seconds. What was the car's average velocity?
0.4 m/s south
0.4 m/s
2.5 m/s
2.5 m/s south

What is the average velocity of the object between 0 and 10 seconds?
6.0 m/s
1.5 m/s
-4 m/s
0 m/s


If you run around the football field (which is 2 miles) 3 times, what is your distance?
0 miles
2 miles
6 miles
9 miles
A car travels 240 km in 2 hours and a sprinter travels 100 m in 9.5 sec. Who is traveling faster?
the car
the sprinter
they are traveling the same speed
not enough information to answer this question


Aliff drove 50 km. What additional information does Aliff need to figure out his average speed?
The reading on his speedometer when he finished his journey.
The duration of his journey.
The exact time when he finished his journey.
The direction he was driving.

______ is the shortest path between two positions.
Distance
Displacement
Length
Breadth

Acceleration can be... (select all that apply)
speeding up
slowing down
staying at constant velocity
changing directions

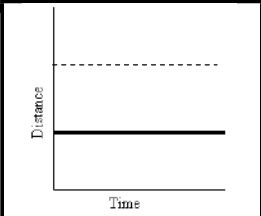
What can you know from the slope of this position vs time graph?
Constant velocity
Increasing velocity
Constant acceleration
Increasing acceleration
Which of the following scenarios provides the best example of an accelerating object?
A car driving at a constant speed on a straight highway
A book sitting on top of a high shelf
A toy train traveling in a circle

These graphs both represent:
decreasing speed
constant speed
acceleration
object at rest
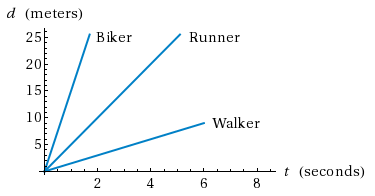
Which person moved the fastest in 3 seconds?
biker
runner
walker
they are all moving equally

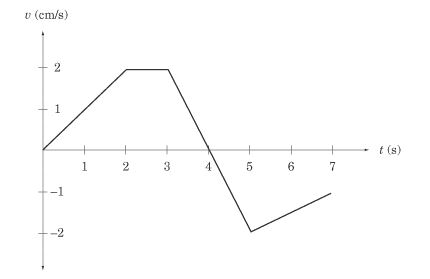
What is happening between 2 and 3 seconds?
The object is not moving.
The object is not accelerating.
The object is slowing down.
The object is speeding up.

This graph show that
the object is throw upward
the object throw downward
the object release from high building

This graph show that
the ball decelerates and then accelerates after bounces off the floor
the ball decelerates and then accelerates after bounces off the wall
The ball stays at rest at the left of the origin, then switches position and continues to stay at rest at the right of the origin.
The ball moves to the left with constant velocity toward the wall and then bounces off the wall with constant velocity.

What is occurring on this graph?
speeding up in the positive direction
moving at a constant speed in the positive direction
not moving
moving at a constant speed in the negative direction
S2 - S1 / t2 - t1 is defined as
average velocity
instantaneous velocity
displacement
instantaneous acceleration

Which of these velocity-time graph is correlated to the displacement-time graph above?


Which of these acceleration-time graph is correlated to the velocity-time graph above?


Slope of velocity time graph is:
Acceleration
Displacement
Distance
Speed

Which graph represents zero acceleration (constant velocity)?
A
B
C
D
When is the average velocity of an object equal to the instantaneous velocity?
Always
Never
Only when the velocity is constant
Only when the velocity is increasing at a constant rate
The area between the velocity-time graph is numerically equal to:
Speed
Displacement
Time
Acceleration
Can an object's velocity change direction when its acceleration is constant? Support your answer with an example.
No, this is not possible because it is always speeding up.
No, this is not possible because it is always speeding up or always slowing down, but it can never turn around.
Yes, this is possible, and a rock thrown straight up is an example
Yes, this is possible, and a car that starts from rest, speeds up, slows to a stop, and then backs up is an example.
An object is moving with constant non-zero acceleration in the +x axis. The position versus time graph of this object is
A horizontal straight line.
A vertical straight line
A straight line making an angle with the time axis.
A parabolic curve
An object is moving with constant non-zero velocity in the +x axis. The velocity versus time graph of this object is
A horizontal straight line.
A vertical straight line
A straight line making an angle with the time axis
A parabolic curve.
The area under a curve in a velocity versus time graph gives
Acceleration
Velocity
Displacement
Position
The area under a curve in an acceleration versus time graph gives
Acceleration
Velocity
Displacement
Position
The slope of a position versus time graph gives
Position.
Velocity.
Acceleration.
Displacement.
Which of the following five acceleration versus time graphs is correct for an object moving in a straight line at a constant velocity of 20 m/s?


A body covering equal displacement in equal interval of time possesses:
Variable velocity
Uniform acceleration
Uniform velocity
None of above
When velocity time graph is a straight line parallel to time axis then:
Acceleration is const
Acceleration is variable
Acceleration is zero
Velocity is zero
A change in velocity over time is known as:
Acceleration
Average speed
Constant speed
Displacement

