
 Worksheets
Linear Motion
Total questions: 65
Worksheet time: 1hrs 17mins
Name
Class
Date
1.
Carlos lives 100 meters from his friend's house. What is his average speed if he reaches his friends house in 50 seconds?
Distance= 100 m
time = 50 seconds
Distance= 100 m
time = 50 seconds
a)
1 m/s
b)
2 m/s
c)
3 m/s
d)
4 m/s
2.
True or False
It is possible for two objects to have the same speed but different velocities
It is possible for two objects to have the same speed but different velocities
a)
true
b)
false
3.
The location of a place or an object is called its....
a)
position
b)
motion
c)
speed
d)
reference point
4.
A car goes from 0 m/s to 60 m/s in a period of 5 seconds find its acceleration.
a)
10 m/s^2
b)
12 m/s
c)
12 m/s^2
d)
11 m/s
5.

which part of the line shows the constant POSITION?
a)
E to F
b)
C to D
c)
all of above
d)
A to B
6.
Speed =
a)
distance / time
b)
time / distance
c)
distance * time
7.
Change in speed over a given period of time is
a)
velocity
b)
motion
c)
speed
d)
acceleration
8.
What is the SI unit for acceleration?
a)
m/s
b)
m
c)
m/s2
d)
s
9.
What is the SI unit for speed
a)
Km
b)
s
c)
m/s
d)
m/s2
10.
Shona cycles at an average speed of 8km/h. How far has she travelled if she cycles for 4 hours?
a)
55km
b)
32km
c)
43km
d)
32miles
11.
How far will a person go if they jog for 2 hours at a speed of 12 km/hr?
a)
6 km
b)
0.5 km
c)
10 km
d)
24 km
12.
You walk 10 meters to math class in 20 seconds. Your average speed is
a)
2 m/s
b)
0.5 m/s
c)
200 m/s
d)
5 m/s
13.
If a cheetah runs 180 miles in 3 hours, what is its average speed?
a)
60 hours
b)
60 miles
c)
60 miles/hour
d)
60 miles/second/second
14.
A runners races in the 100 meter dash. It takes her 10 seconds to finish. What is her average speed?
a)
10 m/s
b)
1000 m/s
c)
100 seconds
d)
10 seconds
15.
Find the velocity of a truck that travels 75 miles north in 2.5 hours.
a)
187.5 mph north
b)
30 mph north
c)
300 mph north
d)
200 mph north
16.
It took 3.5 hours for a train to travel the distance between two cities at a velocity of 120 miles/hr. How many miles lie between the two cities?
a)
34 miles
b)
420 miles
c)
120 miles
d)
360 miles
17.
Which of the following is a unit for acceleration?
a)
km/s
b)
m/s2
c)
mi/hr
d)
ft
18.

How far has the red runner gone in 3 seconds?
a)
40 yards
b)
10 yards
c)
30 yards
d)
20 yards
19.
Acceleration of an object happens when things ________
a)
slow down
b)
go faster
c)
change direction (turn)
d)
All of the above
20.
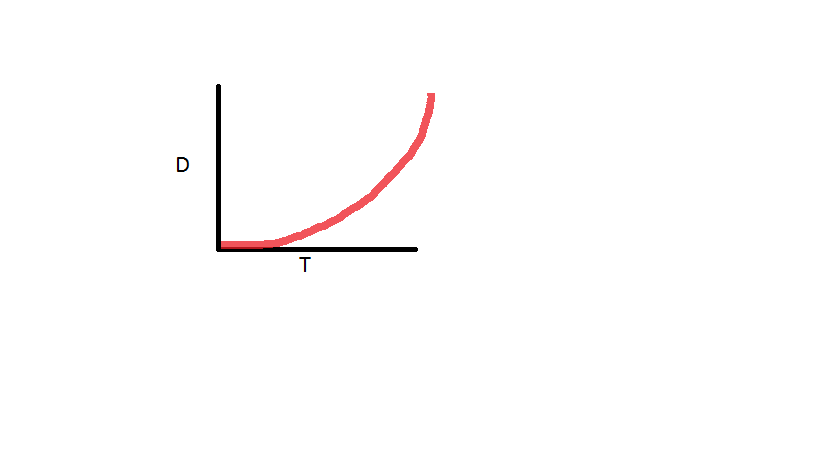
The graph below represents
a)
Speed
b)
Velocity
c)
Acceleration
d)
Deceleration
21.
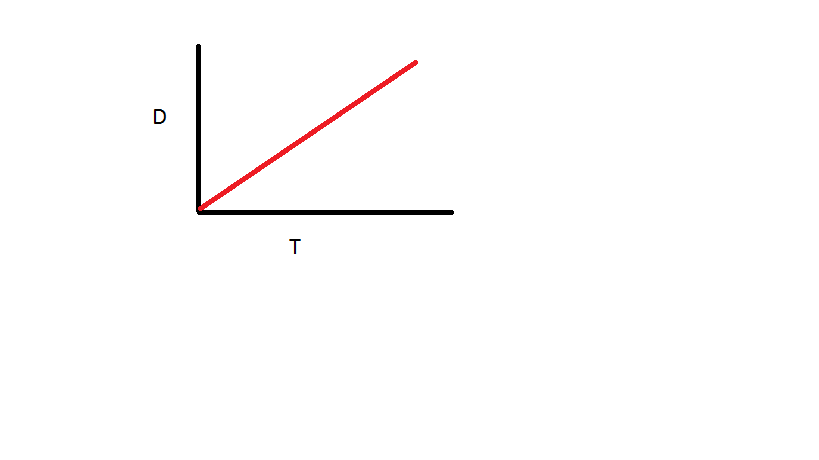
The graph represents
a)
Acceleration
b)
No motion
c)
Deceleration
d)
Constant Velocity
22.
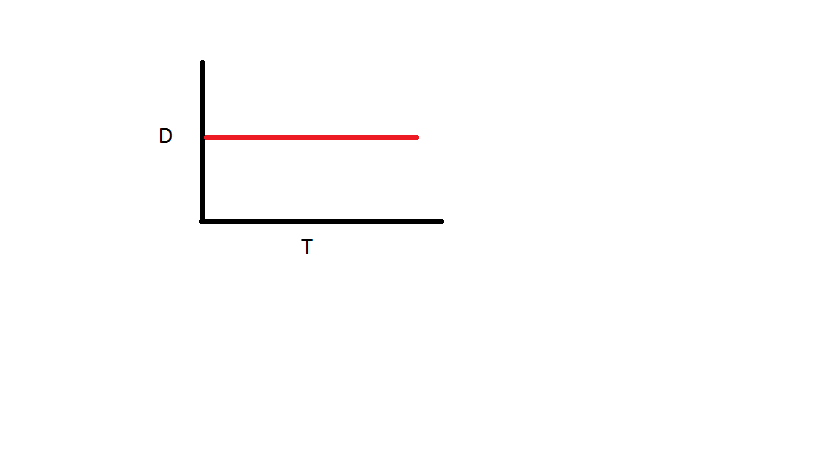
The graph represents
a)
No motion
b)
Constant velocity
c)
Acceleration
d)
Deceleration
23.

The graph respresents
a)
No motion
b)
Constant Velocity
c)
Acceleration
d)
Deceleration
24.

The graph represents
a)
no motion
b)
Constant velocity
c)
Acceleration
d)
negative acceleration
25.

The graph represents
a)
no motion
b)
constant velocity
c)
acceleration
d)
negative acceleration
26.
65 miles per hour North is an example of an objects what?
a)
Speed
b)
Velocity
c)
Average Speed
d)
Constant Speed
27.
10 miles per hour is an example of an objects what?
a)
Velocity
b)
Speed
c)
Acceleration
d)
Inertia
28.
Velocity is
a)
speed
b)
direction
c)
speed with a direction
29.
On a distance vs. time graph, the steeper the slope _____
a)
the slower the speed
b)
the faster the speed
c)
less acceleration
d)
greater acceleration
30.

LT4: The graph shows Ashley riding her bike to Maria's house.
What was occurring from point B to point C?
What was occurring from point B to point C?
a)
She was increasing her speed.
b)
She stopped for 4 minutes
c)
She was decreasing in speed
31.

LT4: The graph shows Ashley riding her bike to Maria's house.
What is occurring from point A to point B?
What is occurring from point A to point B?
a)
they are traveling at a constant speed
b)
they are decreasing in speed
c)
they stopped to take a break
32.

Marcia went on a day cruise along the Florida coast. The graph shows the distance the boat traveled each hour.Which statement explains why the graph cannot be used to determine the boat’s average velocity?
a)
The speed of the boat is not constant.
b)
The direction of the boat is not given
c)
The boat was stationary for one hour
d)
The boat’s average speed is unknown
33.
Distance is
a)
a scalar quantity
b)
a vector quantity
c)
described with both magnitude and direction.
d)
is described as a direction only
34.

Which of the following best describe the line on the position-time graph? A. B. C. D.
a)
Zero slope, object at rest
b)
Negative slope, object at rest
c)
Zero slope, object in motion
d)
Negative slope, object in motion
35.

Imagine a small stick man walking around the edges of a rectangular carpet.
If the stick man walks around the entire 1.0 m x 1.5 m carpet and finishes in same position as he started, what is the distance he has travelled?
If the stick man walks around the entire 1.0 m x 1.5 m carpet and finishes in same position as he started, what is the distance he has travelled?
a)
2.5
b)
5
c)
1.8
d)
0
36.

This graph shows
a)
An object stopped
b)
An object slowing down
c)
An object speeding up
d)
An object moving at constant speed
37.

This graph shows
a)
An object stopped
b)
An object speeding up
c)
An object slowing down
d)
An object moving at constant speed
38.

This graph shows
a)
An object stopped
b)
An object moving at constant speed
c)
An object slowing down
d)
An object speeding up
39.

This graph shows
a)
An object stopped
b)
An object slowing down
c)
An object speeding up
d)
An object moving at constant speed
40.

Which quantity is a vector?
a)
Displacement
b)
Distance
41.

A speedometer shows a "snapshot" or "freeze frame" of a car's motion. This is called
a)
instantaneous speed.
b)
average speed.
c)
velocity.
d)
displacement.
42.
Speed is equal to
a)
Distance/Time
b)
Time/Distance
c)
Time x Distance
d)
Acceleration
43.

This graph shows
a)
An object speeding up
b)
An object stopped
c)
An object speeding up
d)
An object slowing down
44.
Which of the following is an example of velocity?
a)
The ducks fly 2 m/s south
b)
The ducks fly 2 meters in 1 second
c)
The ducks slow down as they land
d)
The ducks fly at a constant speed
45.
True or False
Velocity and acceleration are always in the same direction.
Velocity and acceleration are always in the same direction.
a)
True
b)
False
46.
The slope of a displacement vs time graph is...
a)
displacement
b)
velocity
c)
acceleration
47.

A golf ball accelerates off a tee at 15m/s2, changing its velocity from 0m/s to 50 m/s down the fairway. How long did it take the golf ball to accelerate?
a)
750 seconds
b)
35 seconds
c)
0.3 seconds
d)
3.3 seconds
48.

A roller coasters accelerates from an initial velocity of of 6.0 m/s to a final velocity of 70 m/s over 4 seconds. What's the acceleration?
a)
24 m/s2
b)
18 m/s2
c)
16 m/s2
d)
16 m/s
49.

Which graph shows the object standing still?
a)
A
b)
B
c)
C
d)
D
50.

Which graph demonstrates the greatest positive speed?
a)
A
b)
B
c)
C
d)
D
51.

Which graph represents zero acceleration (constant velocity)?
a)
A
b)
B
c)
C
d)
D
52.
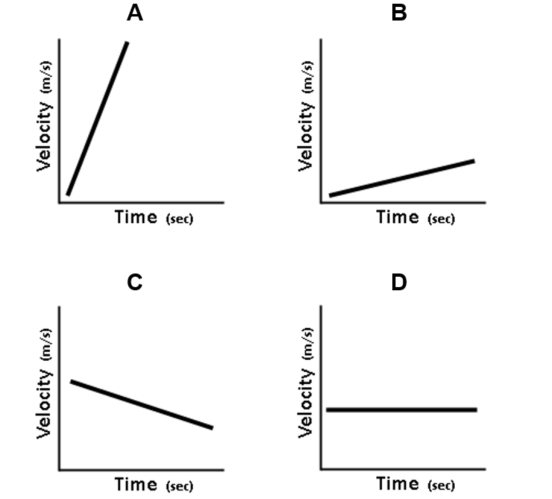
Which graph represents the greatest acceleration?
a)
A
b)
B
c)
C
d)
D
53.
When are you undergoing an acceleration in a car?
a)
speed up
b)
slow down
c)
make turns
d)
All of the above
54.
What kind of quantity has both a magnitude and a direction?
a)
scalar
b)
vector
c)
frame of reference
d)
time
55.
Acceleration only takes place when things speed up.
a)
True
b)
False
56.

Determine the motion of the car.
a)
at rest
b)
constant velocity
c)
speeding up
d)
slowing down
57.

Determine the motion of the car.
a)
at rest
b)
moving at constant speed
c)
speeding up
d)
slowing down
58.
A dog runs with an initial speed of 7.5 m/s to a stop in 15 seconds. What is the acceleration?
a)
-7.5 m/s
b)
-7.5 m/s2
c)
-0.5 m/s2
d)
7.5 mi//hr
59.

During which interval is the object not moving?
a)
B to C
b)
C to D
c)
D to E
d)
only at point A
60.

Calculate the acceleration for segment A.
a)
2 m/s2
b)
20 m/s2
c)
-2 m/s2
d)
0 m/s2
61.
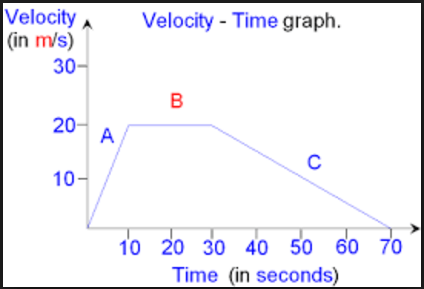
This is a velocity-time graph. What is the object doing in segment C?
a)
Positive acceleration
b)
Negative acceleration
c)
Constant Velocity
d)
Not moving
62.
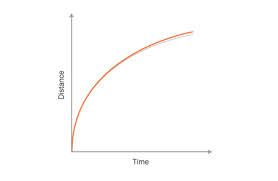
What is this graph showing?
a)
Constant Speed
b)
Acceleration (speeding up)
c)
Deceleration (slowing down)
d)
No motion
63.

If the object was moving from right to left, what type of motion created the dot diagram for Z?
a)
an object at rest
b)
an object moving with a constant velocity
c)
an object getting faster
d)
an object getting slower
64.

What type of motion created the dot diagram for X?
a)
an object at rest
b)
an object moving with a constant velocity
c)
an object getting faster
d)
an object getting slower
65.
Which one of these describes the motion dot diagram created by an object that is getting faster?
a)
The spacing between the lots remains constant.
b)
The spacing between the dots gets smaller.
c)
The spacing between the dots gets larger.
d)
There is only one dot.
100 %

