
 Worksheets
Motion Graphs
Total questions: 25
Worksheet time: 39mins


What happened during C to D point?
not moving
increasing speed at a constant rate
moving at a constant speed
decreasing speed

What happened during E to F point?
not moving
increasing speed at a constant rate
moving at a 5 m/s
slowing down

What happened during A to B point?
standing still
moving at a constant speed
speeding up
moving at 0 m/s


which part of the line shows the motion stopped?
E to F
C to D
all of above
A to B


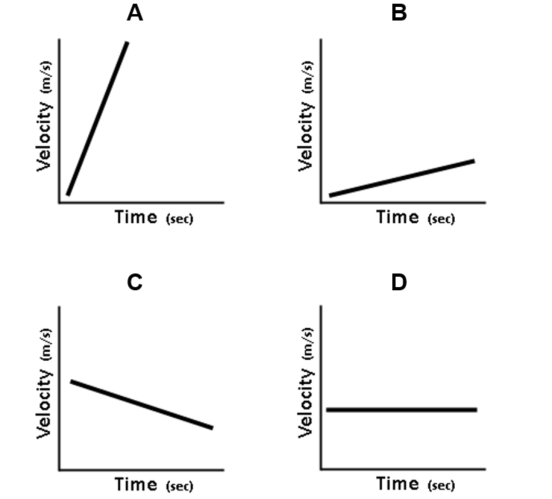
Which runner went the fastest?
A
B
C




What is the total distance that the object travels?
40m
80m
100
100m

What is the average speed (total distance/total time) for this graph?
0,8 m/s
0.4 m/s
1.25 m/s
2.5 m/s

The graph shows the distance a toy car travelled over time. What was the average speed of the toy car represented in the graph?
125 km/min
12.5 km/min
0.1 km/min
0.05 km/min

The motion of a ball is shown in the graph. Calculate the average speed of the ball represented in the graph.
0.2 m/s
0.1 m/s
0.5 m/s
5.0 m/s
A ball rolls 144 cm in 12 sec. What is its speed in meters per second?
12 cm/sec
12 m/s
1.2 m/s
0.12 m/s
Students observed a turtle in the schoolyard. They measured the distance that the turtle traveled in 30 minutes. If the turtle walked 40 meters in that time, what was its average speed in m/h?
0.75 m/h
20 m/s
80 m/h
1,200 m/h
Which of the following statements about speed and velocity is correct?
Velocity only describes an object’s rate of motion.
Speed describes how an object is changing its velocity.
Speed and velocity both describe how an object is speeding up.
Only velocity includes the direction an object is traveling.
Which of these is Acceleration?
Turning a corner
Slowing down
Running faster
Jogging at constant speed

