
 Worksheets
Analyzing Graphs and Scientific Inquiry
Total questions: 14
Worksheet time: 31mins
Name
Class
Date
1.

What conclusions can you draw from this graph?
a)
The deer population went down over time.
b)
The deer population went up over time.
c)
The dear population went up quickly, then down, but then stayed the same.
d)
There are less dear because of hunters
2.
You want to make a graph for an experiment you did about plant growth over a two week period of time. What type of graph would you use?
a)
bar graph
b)
line graph
c)
pictograph
d)
pie chart
3.

What is this graph showing you?
a)
The worlds population is staying the same.
b)
The worlds population is going down (decreasing).
c)
The worlds population was growing but now is decreasing.
d)
The worlds population has been growing and will continue to grow.
4.

T7 - What type of graph is this?
a)
Pie chart
b)
Histogram
c)
Bar graph
d)
Line graph
5.
The purpose of graphs, charts and tables is to
a)
help scientists visualize results from an experiment.
b)
make the experiment look nice.
c)
practice what I learned in Math class.
d)
Practice my drawing skills.
6.
T7 - What graph do you use to represent time or distance?
a)
Bar graph
b)
Data table
c)
pie chart
d)
Line graph
7.
T8 - The Independent Variable is represented on which Axis?
a)
A
b)
X
c)
B
d)
Y
8.

How many sophomores like burritos and pizza?
a)
6
b)
5
c)
11
d)
50
9.

A scientist collected the following data on algal growth during an experiment:
Which of the following conclusions could be drawn from the data?
Which of the following conclusions could be drawn from the data?
a)
Algae multiply most rapidly at 35°C.
b)
Algae multiply most slowly at 20°C.
c)
Algae multiply most slowly at 10°C.
d)
Algae multiply most rapidly at 20°C.
10.

What conclusion can you draw from this line graph?
a)
For the most part, the older the teenagers get, the more likely they are to have a cell phone.
b)
Older teens have less cell phones.
c)
People in their thirties have the least cell phones.
d)
No one should own a cell phone.
11.

Mr. Swanson's science class used a thermometer to measure the outside temperature each day throughout the school year.
They used their results to make the graph below.
Which month had an average daily temperature of around 41 degrees?
They used their results to make the graph below.
Which month had an average daily temperature of around 41 degrees?
a)
May
b)
April
c)
December
d)
March
12.

How many students ride their bicycle to school?
a)
40
b)
35
c)
30
d)
20
13.
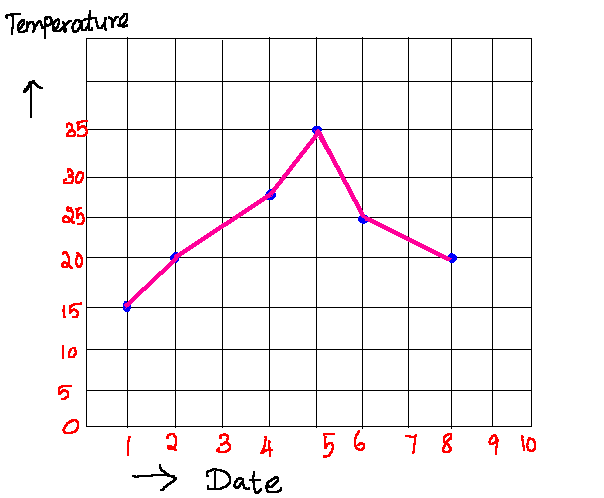
On which 2 days was the temperature the same?
a)
2 and 8
b)
1 and 6
c)
3 and 4
d)
5 and 8
14.

The final results and answers to your big question is shared in your ________________.
a)
conclusion
b)
hypothesis
c)
observation
d)
inquiry
100 %

