
 Worksheets
Apes
Total questions: 25
Worksheet time: 25mins
A student is setting up a model to study the carbon cycle and natural sources of carbon dioxide. They create a microenvironment that contains soil, leaf debris, an earthworm, heterotrophic bacteria, and a sun lamp. What natural source of carbon dioxide and major metabolic process was left out of the model?
There is no representation of ingestion in the model environment
There is no representation of photosynthesis in the model environment.
There is no representation of cellular respiration in the model environment.
There is no representation of decomposition in the model environment.
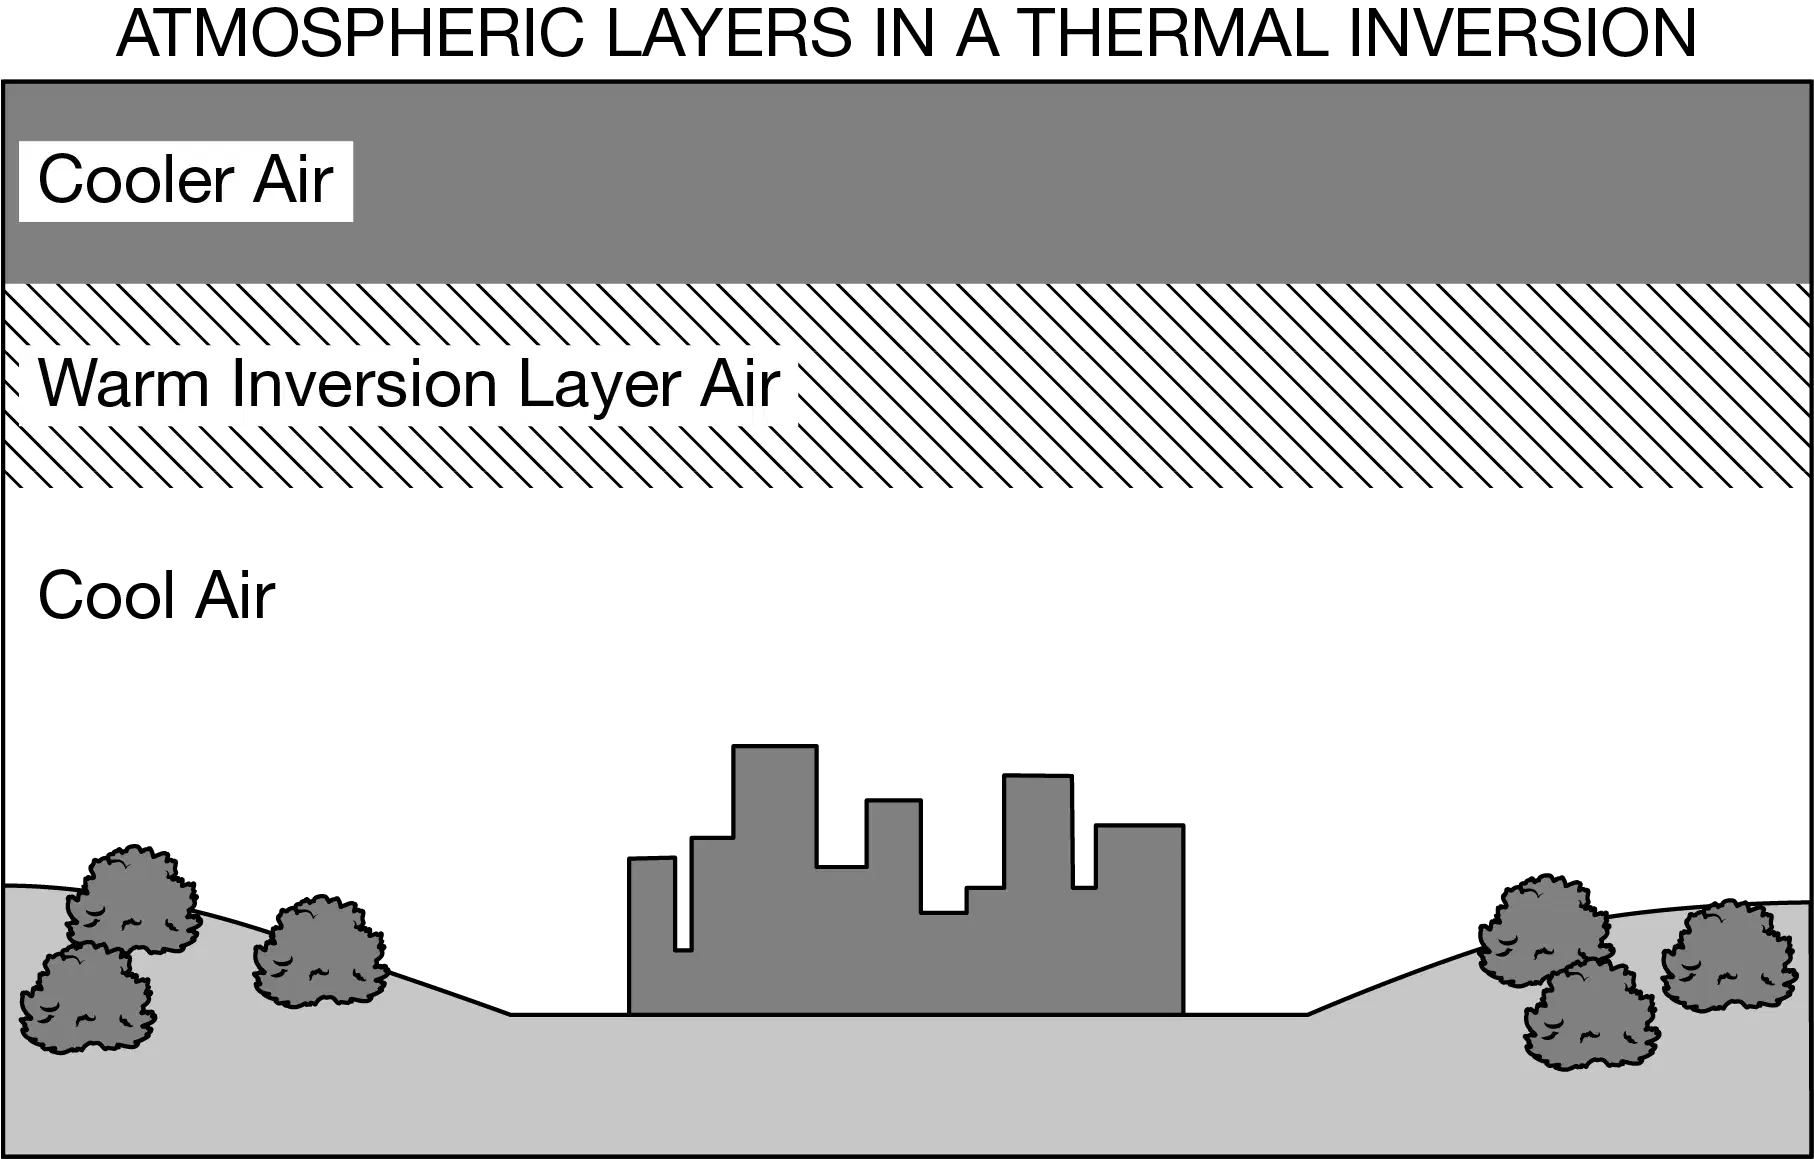
Based on the layers in the diagram, which of the following best explains why a thermal inversion tends to concentrate pollutants in the air layer closest to the Earth’s surface?
The air layer that is the second closest to the Earth’s surface is less dense than the layer above it.
The inversion layer is warmer than the air layer that is farthest from the Earth’s surface.
The air layer closest to the Earth’s surface is denser than the layer above it.
The air layer that is farthest from the Earth’s surface contains the coolest air.

Which of the following best explains the cause of the trend shown in the graph for lead emissions in the United States from 1970 to 2011 ?
By 1990, all new model cars were equipped with internal fabric filters that effectively filtered car exhaust and reduced lead emissions.
Beginning in 1975, The Clean Air Act required new cars to have catalytic converters, which effectively converted the lead found in gasoline to water vapor.
New air-scrubber technologies were introduced in the late 1970s that effectively removed lead in the air and converted it into water vapor.
Unleaded gasoline was first introduced in 1974, and amendments to the Clean Air Act required cars with the model year 1975 or later to use only unleaded gasoline.
Over a three-year period, a city’s environmental protection department measured the particulate matter (PM2.5) in a ten-square-mile area around one of the city’s coal-fired power plants. The annual mean level of PM2.5 measured was 20.0μgm3 over the three-year study period. The National Ambient Air Quality Standard (NAAQS) for PM2.5 is an annual mean level of 12.0μgm3, averaged over three years. The city instructs the manager of the power plant to propose a plan to aid the city in meeting the NAAQS for PM2.5 in the area around the power plant over the next ten years. Which of the following would be the most effective plan for the manager to propose to the city?
Burn lignite coal instead of bituminous coal at the plant.
Install electrostatic precipitators at the plant.
Install vapor recovery nozzles at the plant.
Install catalytic converters at the plant.

Which letter represents amplitude? (a)
A
B
C
D
E
Ground-level ozone in most major United States cities results primarily from
burning coal
burning fuel for cooking
producing electric power
industrial emissions
motor-vehicle exhaust
Directions: Select the choice that best fits each statement. The following question(s) refer to the following air pollutants. Implicated in human neurological damage
Sulfur dioxide
lead
ozone
hydrocarbons
particulates

The graph below depicts the various components of smog for a densely populated urban area in the Northern Hemisphere. Each plotted line (AA, BB, CC, and DD) is a different component of smog.
Which of the curves on the graph depicts the concentration of ozone, which requires sunlight to form?
A
B
C
D

Which of the different components of smog depicted in the graph are most likely released from automobile exhaust?
A and B
B and C
A, B, and C
B, C, and D

The graph below depicts the various components of smog for a densely populated urban area in the Northern Hemisphere. Each plotted line (AA, BB, CC, and DD) is a different component of smog. The data that were used to create this graph were collected in the winter. Which of the following best describes how the graph would be different if the data were collected in the middle of the summer?
The peaks for every data line would be at a lower concentration.
Concentrations for component C would be higher throughout the graph.
Concentrations for all the data lines would be the horizontal throughout the day.
Components A, B, and D would peak in the afternoon instead of in the morning.
The three main anthropogenic sources of gaseous air pollutants in the United States are
industry, transportation, and agriculture
industry, transportation, and energy production
industry, construction, and agriculture
soil erosion, volcanoes, and energy production
soil erosion, volcanoes, and forest fires
Which type of electricity-generating power plant releases radioactive materials as well as toxic metals such as lead and arsenic under normal operating conditions?
nuclear
solar
coal-burning
hydroelectric
geothermal
Scientists have been monitoring CO2 in the atmosphere from Mauna Loa in Hawaii since 1958. Which units are used by scientists to measure CO2 in the atmosphere?
pH
Parts per million
Dobson units
Percent saturation

The figure below illustrates how a thermal inversion can form over major urban centers. In the figure above, the letters A, B, and C represent the different thermal layers present in an inversion. Which of the following shows the correct sequence of thermal layers as one moves vertically upwards from the surface of the Earth?
Cool sea breeze →→ Cooler →→ Coolest
Cool sea breeze →→ Warm →→ Cool
Warm sea breeze →→ Warm →→ Cool
Warm sea breeze →→ Cool →→ Warm

If the air layers in the diagram were relabeled to illustrate normal atmospheric conditions, the correct labeling from the air layer closest to the Earth’s surface to the one farthest from the Earth’s surface would be
cool air, cooler air, warm air
warm air, cool air, cooler air
cooler air, warm air, cool air
cooler air, cool air, warm air

Canada has proposed an action plan to address climate change and air pollution. The action plan will reduce the impact of greenhouse gases and pollutants on the environment and human health. Which of the following claims about the Canadian action plan is best supported by the data in the graph?
The plan encourages the transition from electricity generation from nuclear power to electricity generation from cleaner-burning natural gas.
The plan focuses on increasing regulation on installation and maintenance of catalytic converters in vehicle exhaust systems.
The plan supports phasing out traditional coal power plants and transitioning to sources like hydroelectricity, wind, and solar power.
The plan provides a strategy for reducing the amount of plastic wastes in landfills through the production of long-lasting and durable plastics.

The Environmental Protection Agency (EPA) of the United States recommends taking corrective measures to reduce exposure to radon gas. The EPAEPA has set an action level of 4 pCi/L for radon gas. The graph below shows radon samples taken from seventeen buildings in California. The radon samples were taken from the air inside the buildings, and the uranium concentrations were sampled from the soil under the buildings. Data points from four of the seventeen building locations are labeled A-D.
Location A has the greatest need for remediation because the radon levels in the building are the highest and exceed the EPA action level.
Location B has the lowest need for remediation because the radon levels in the building are below the suggested action level.
Location C has the greatest need for remediation because the radon levels in the soil are the highest.
Location D has the lowest need for remediation because there is no measurable radon in the air or the soil samples.

Scientists have observed that the health of people living in moderately developed regions, which have developed transportation and industry but lack environmental control measures, is more likely to be affected by urban outdoor pollution than by indoor air pollution. Which of the following conclusions can be drawn from the data presented in the graph?
In moderately developed regions such as China and Latin America, an individual’s health is more or as likely to be affected by urban outdoor pollution than by indoor pollution.
Developing regions such as sub-Saharan Africa are less affected by indoor air pollution because there is no source of radon in the region.
Indoor air pollutants decrease and urban outdoor pollutants increase as countries become more industrialized.
The amount of both indoor and outdoor air pollution is directly linked to the size of each region.

Scientists have observed that the health of people living in moderately developed regions, which have developed transportation and industry but lack environmental control measures, is more likely to be affected by urban outdoor pollution than by indoor air pollution. Which of the following activities would most likely account for the levels of indoor air pollution in India and sub-Saharan Africa, as shown in the graph?
Construction of homes with more efficient insulation and increased ventilation
Use of biomass fuel sources such as wood and charcoal for cooking
Industrial power plants burning fossil fuels for electrical energy generation
Use of chemical pesticides on croplands
Which of the following is NOT a criteria air pollutant listed by the EPA
SO2
NOx
O3
CO2
PM
Why is CO2 not considered an criteria pollutant?
It is not proven to do any harm in the atmosphere.
It does less harm in the atmosphere than the listed criteria pollutants.
It does not directly lower air quality from a human health standpoint.
Which of the following is a characteristic that distinguishes apes from other primates?
Opposable thumbs
Lack of a tail
Prehensile tail
Nocturnal behavior
What is the primary habitat of most ape species?
Deserts
Savannas
Tropical rainforests
Arctic tundra
Which of the following apes is known for its ability to use tools in the wild?
Gorilla
Orangutan
Gibbon
Chimpanzee
In terms of evolutionary biology, which of the following is considered the closest living relative to humans?
Gorillas
Orangutans
Gibbons
Chimpanzees

