
 Worksheets
Time Distance Graph
Total questions: 15
Worksheet time: 15mins

The graph shows Ashley riding her bike to Maria's house.
What is occurring from point A to point B?
they are traveling at a constant speed
they are decreasing in speed
they stopped to take a break

The graph shows Ashley riding her bike to Maria's house.
What was occurring from point B to point C?
She was increasing her speed.
She stopped for 4 minutes
She was decreasing in speed
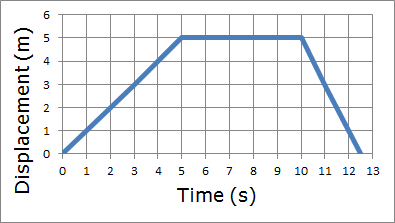
According to the graph how far does the person travel in the first 5 seconds?
2 m
10 m
0 m
5 m

Which graph shows the object standing still?
A
B
C
D

What is happening at A?
Stationary
Accelerating
Slower steady speed; moving away from the starting position
Steady speed; returning to start position

What is happening in this graph from point A to B?
The object is accelerating.
The object is not moving.
The object is decelerating.
The object is moving at a constant speed.

What is happening in this graph from point B to C?
The object is going down a hill.
The object is returning to its starting location.
The object is slowing down.
The object is staying still.

A student runs two times around a running path at a local park. Each lap is 3 km. The student completes the first lap in 20 minutes. The student then sits on a bench and rest for 5 minutes before completing the second lap in 25 minutes. Which graph bests represents the student's motion?
F
G
H
J

Molly is watching a wind-up toy walking across a table. She observes that the toy covers 1 cm every second for 10 seconds. Which graph do you think most closely represents the toy's journey across the table?
A
B
C
D

Every morning John walks a half mile to school. One morning on the way to school, he stopped to watch some deer in the field. When he realized he was late, he ran the rest of the way to school to avoid being late. Which graph below shows John's speed during his walk to school?
A
B
C
D

Which runner won the race?
A
B
C

At what time did runner A pass runner B?
0 seconds
1 second
2 seconds
3 seconds
Which of the following statements is true about a time-distance graph for an object moving at constant speed?
The graph is a straight line with a positive slope.
The graph is a curve with a decreasing slope.
The graph is a horizontal line.
The graph is a vertical line.
In a time-distance graph, what does the slope of the line represent?
The speed of the object.
The acceleration of the object.
The distance traveled by the object.
The time taken by the object.
If a time-distance graph shows a horizontal line, what can be inferred about the object's motion?
The object is moving at a constant speed.
The object is accelerating.
The object is stationary.
The object is moving in reverse.

