
 Worksheets
Levels 5 and 6: Tables, Statistics, and Probability Set
Total questions: 132
Worksheet time: 6hrs 21mins
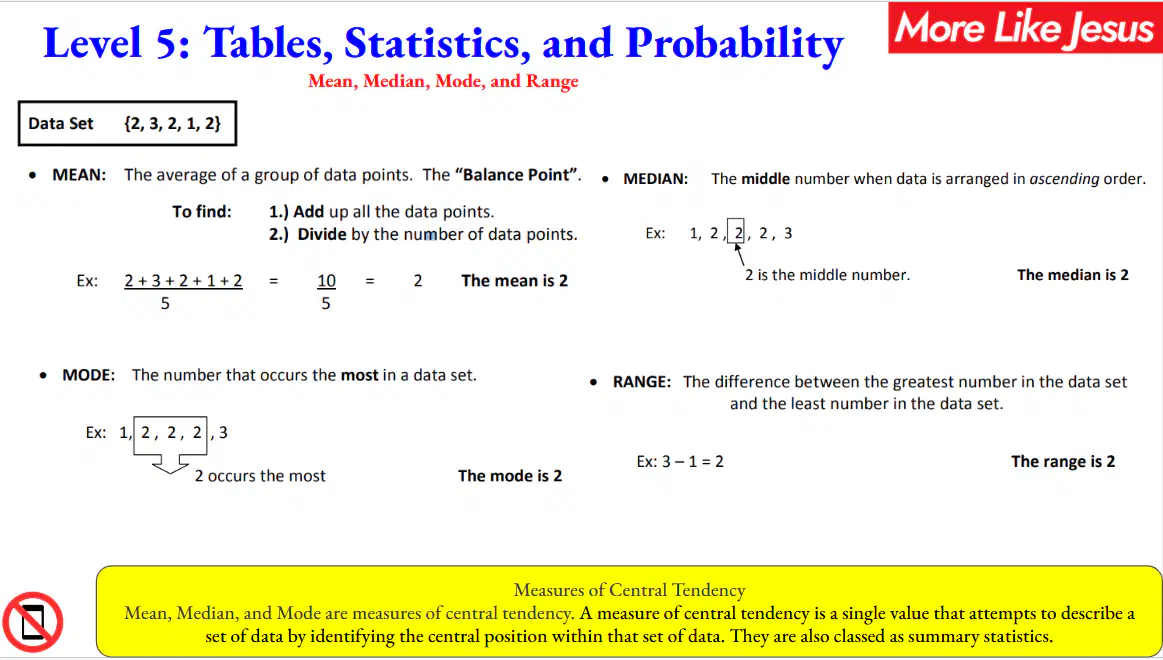
Kindly confirm that these insights are in your notes or that you already have them mastered by typing "Done"
(a)
TSP.1
Which describes the "median"
The average of a group of data points
The number that occurs most in a data set
The middle number when data is arranged in ascending order
The difference between the greatest number in the data set and the least number in the data set
TSP.2
Which describes the "mean"
The average of a group of data points
The number that occurs most in a data set
The middle number when data is arranged in ascending order
The difference between the greatest number in the data set and the least number in the data set
TSP.3
Which describes the "mode"
The average of a group of data points
The number that occurs most in a data set
The middle number when data is arranged in ascending order
The difference between the greatest number in the data set and the least number in the data set
TSP.4
Which describes the "range"
The average of a group of data points
The number that occurs most in a data set
The middle number when data is arranged in ascending order
The difference between the greatest number in the data set and the least number in the data set

TPS.5
At Dylan's Donuts, the number of donut holes in a bag can vary. Help Dylan find the mode.
12,10,10,10,13,12,11,13,10
TPS.6
Find the mean of these numbers:
5,11,2,12,4,2
(a)
TPS.7
Find the median of these numbers:
4,2,7,4,3
(a)
TPS.8
Find the mean of these numbers:
2, 57, 38, 42, 6
(a)
TPS.9
To find the mean of a set of numbers, add up all the items and divide by...
TPS.10
In order to find the median, the data must be sorted from least to greatest first.
TPS.11
Find the median.
12, 5, 9, 18, 22, 25, 5
(a)
TPS.12
Find the mean.
90, 100, 95, 85, 60, 80
(a)
TPS.13
The number of miles that Jenna cycled each week for a 7-week period is shown:
36, 42, 28, 52, 48, 36, 31
What is the median number of miles Jenna cycled?
(a)
TPS.14
The number of pages that Carolyn wrote in her journal each day from Monday to Friday is shown below:
9, 8, 12, 6, 10
What is the mean number of pages she wrote per day?
(a)
TPS.15
Which of the following are measures of central tendency?
Mean
Median
Mode
Range
Standard Deviation
TPS.16
8.4÷0.03
(a)
TPS.17
48.4 ÷0.02
(a)
TPS.18
4.56÷0.4
(a)
TPS.19
23.1÷0.7
(a)
TPS.20
182.88÷0.08
(a)
TPS.21
0.36÷0.06
(a)
TPS.22
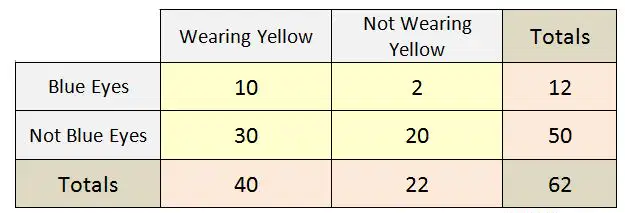
How many total people have blue eyes?
(a)
TPS.23
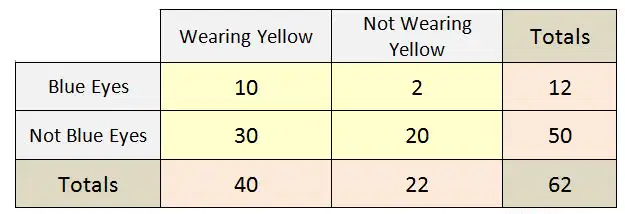
How many total people wore yellow?
(a)

TPS.24
What color car is the least popular at this car dealership?
(a)

TPS.25
Which age group liked Action movies the least?
18-25
25-49
50+
238
TPS.26
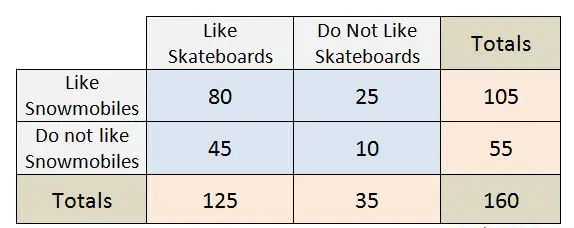
How many people like both skateboards & snowmobiles?
(a)

TPS.27
How many people purchased a hot dog?
50
62
46
158
TPS.28
How many people purchased a hot dog and water?
(a)

TPS.29
How many students were surveyed in the "Biking to School" two-way table?
(a)

TPS.30
What percentage wear sandals
Kindly round to the nearest whole number and include the percentage sign
(a)

TPS.31
How many people purchased no food and no drink?
(a)

TPS.32
How many sophomores like burritos and pizza?
(a)

TPS.33
How many more children prefer playing cricket than netball?
(a)

TPS.34
What sport is the most popular?
(a)

TPS.35
35 children were asked if they prefer cats or dogs. The data is shown in the table. How many girls prefer dogs?
Don't have enough information
2
23
29

TPS.36
Which sport(s) is least popular?
If there's a tie, enter both sports separated by the word "and".
(a)

TPS.37
What percent of people who attended the basketball game also attended the school play?
Kindly round to the nearest whole number and include the percent symbol
(a)

TPS.39
How many total have no cell phone?
(a)

TPS.40
How many total people were surveyed?
(a)
TPS.41
How many sophomores like burritos and pizza?
(a)
TPS.42
In a class of 25 students, 80% of students maintain an A average. How many students don't have an A average?
(a)
TPS.44
Which age group liked Action movies the least?

TPS.45
How many females were surveyed?
(a)

TPS.46
Of the mechanical engineers, what is the probability that math is their favorite subject?
Kindly enter your value as a percentage rounded to the nearest whole number (if necessary), and include the percent sign.
(a)

TPS.48
What was the most popular party type?
(a)

TPS.49
A survey explored the relationship between gender and band class. Which is a reasonable conclusion?
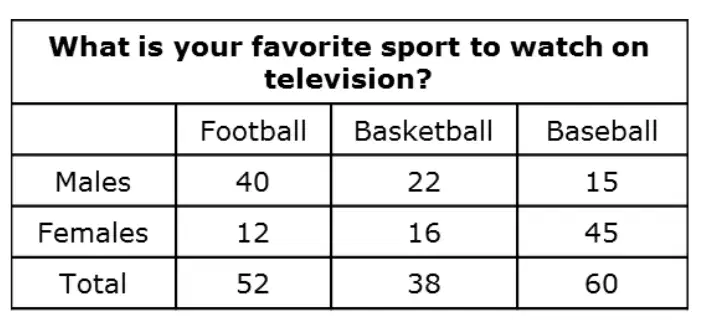
TPS.50
What percent of all students were females who prefer football?
(a)

TPS.60
What is the probability that the person picked will be a boy given they speak German?
Kindly enter a decimal value rounded to the nearest ten-thousandth
(a)

TPS.61
What is the probability that they speak French given they are a girl?
Kindly enter decimal value
(a)

TPS.62
What is the probability that a student does play a sport given they do not play an instrument?
Kindly enter a decimal value rounded to the thousandths place
(a)

TPS.63
What is the probability that a female is chosen given they like a Toyota?
Kindly enter a decimal value rounded to the hundredths place
(a)
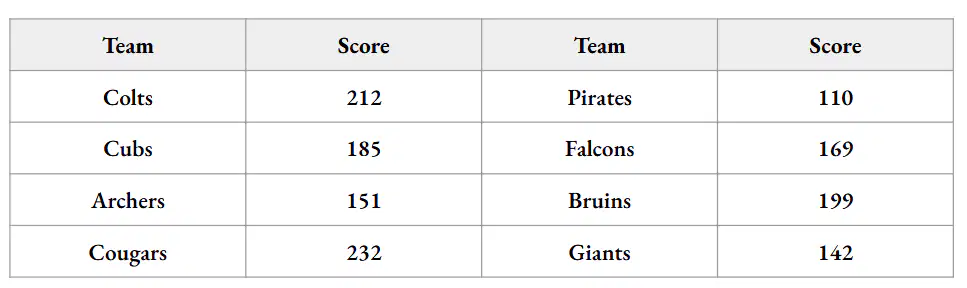
TPS.PS.5
The given table shows the bowling scores for 8 teams. Based on the table, what is the mean score of the teams?
(a)

TPS.67
Find the median of Ludah Jindstam's points
10,6,15,12,30,20
13.5
15
12 and 15
There's no median
12
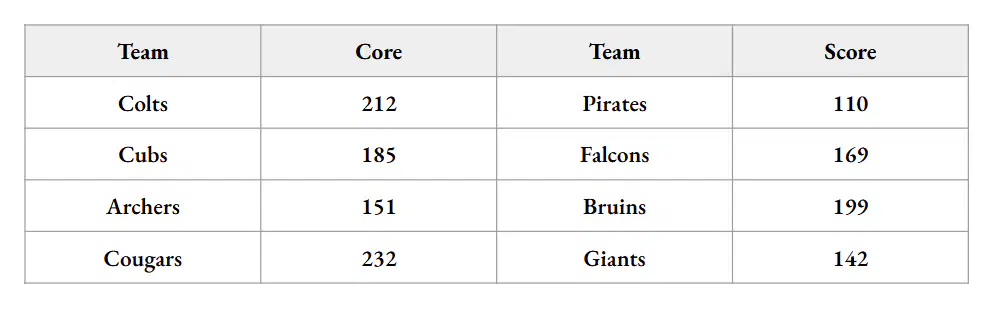
TPS.PS.6
If to correct for an error, the score for Team Archers was changed to 251, how does the change affect the mean and median score of the teams?
Mean and median will both decrease
Mean will decrease, and median will increase
Mean will increase, and median will decrease
Mean and median will both increase

TPS.68
Raymond Junior High students vote for ‘Teacher of the year’. The results of this year’s voting are shown in the bar graph.
How many students in total voted for the election?
400
125
375
500
TPS.70
Which statement is supported by the information in the graph?
One half of the students voted for Ms. Lopez or Mrs. Jones
Mrs. Gomez received 50% of the total votes.
Ms. Lopez received 75% of the total votes.
Five hundred students voted in the “Favorite Teacher” elections
TPS.PS.15
A machine produces 200 products per hour at a constant rate. Which of the following sampling procedures would be the most effective in determining the overall quality of an eight-hour production run?
Test 10 products at the beginning of the day and 10 at the end of the day
Test 6 consecutive products every hour
Test 20 products at some time during the production run
Test 6 products per hour at random intervals

TPS.70
How many students voted for their favorite sport?
(a)
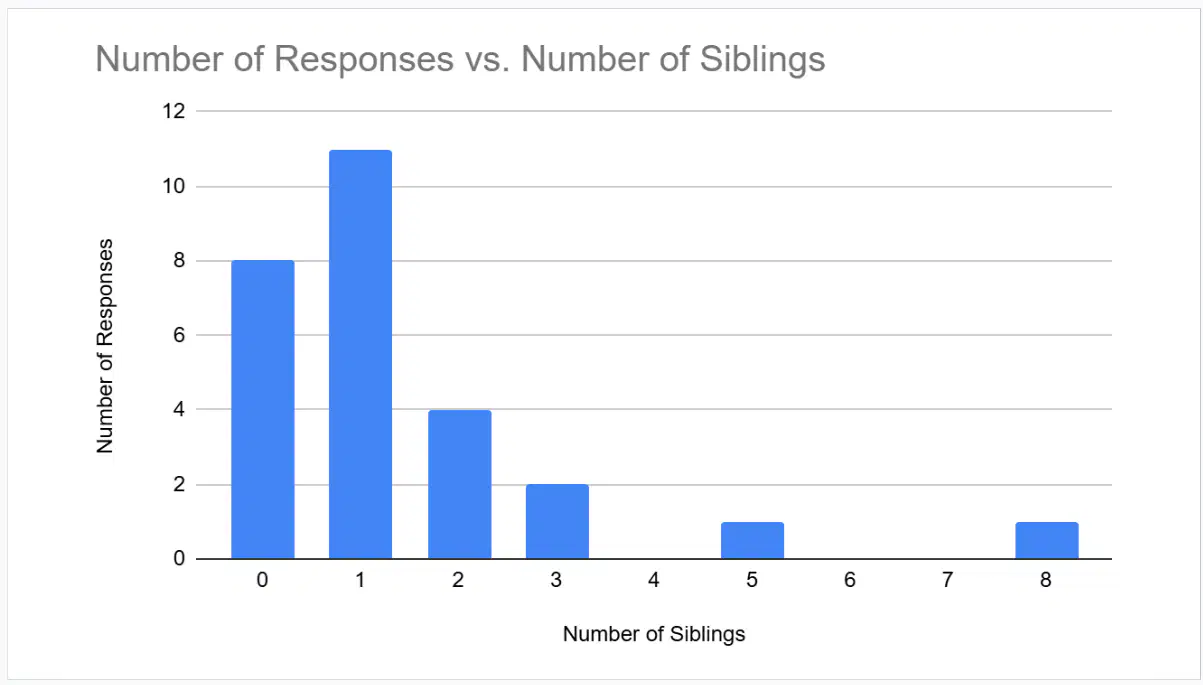
TPS.72
What is the mode of this data?
11
1
2
3
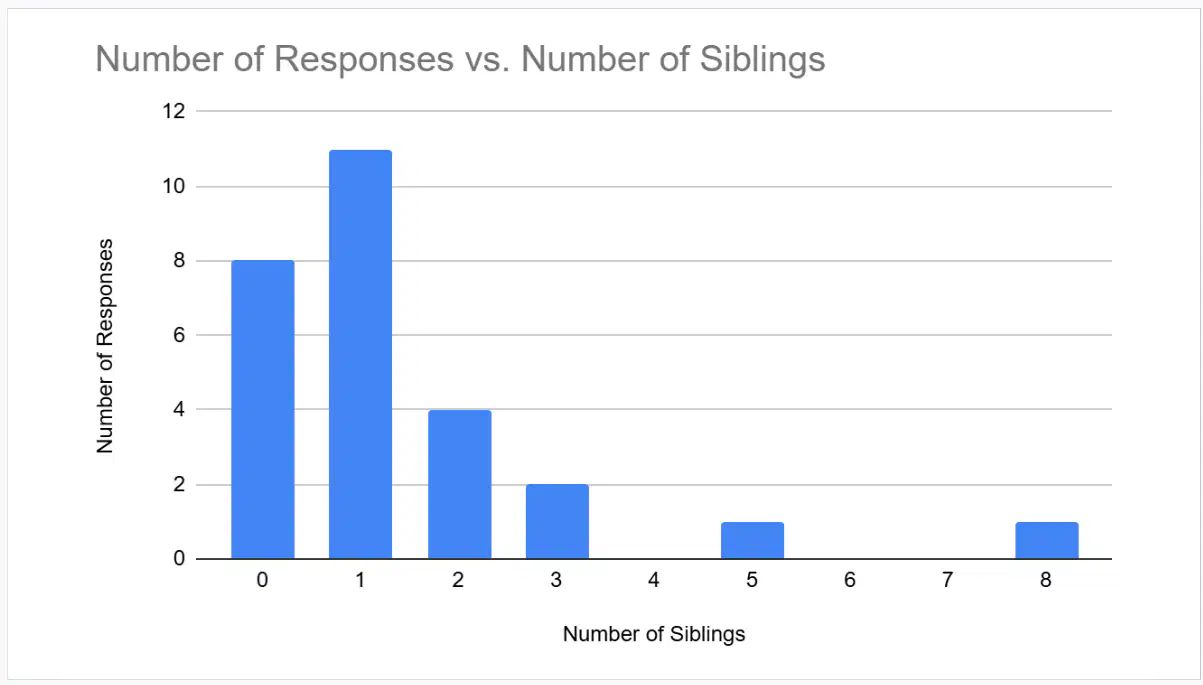
TPS.72
What is the number of people interviewed in this study?
(a)

TPS.73
What is the median of the data?
(a)
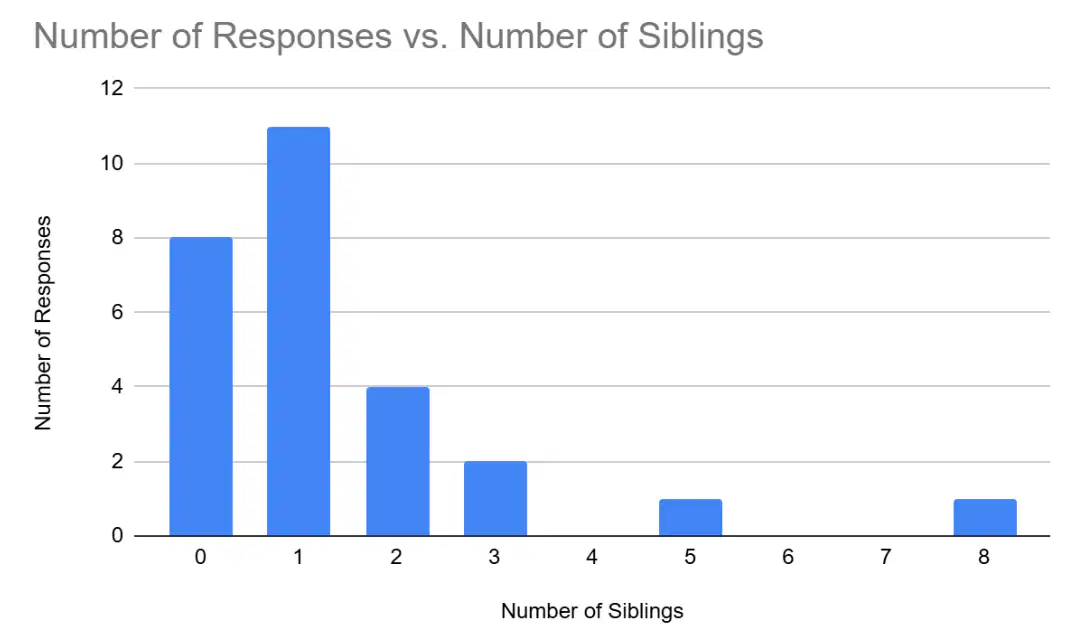
What is the total number of siblings among these 27 people?
27
38
11
4
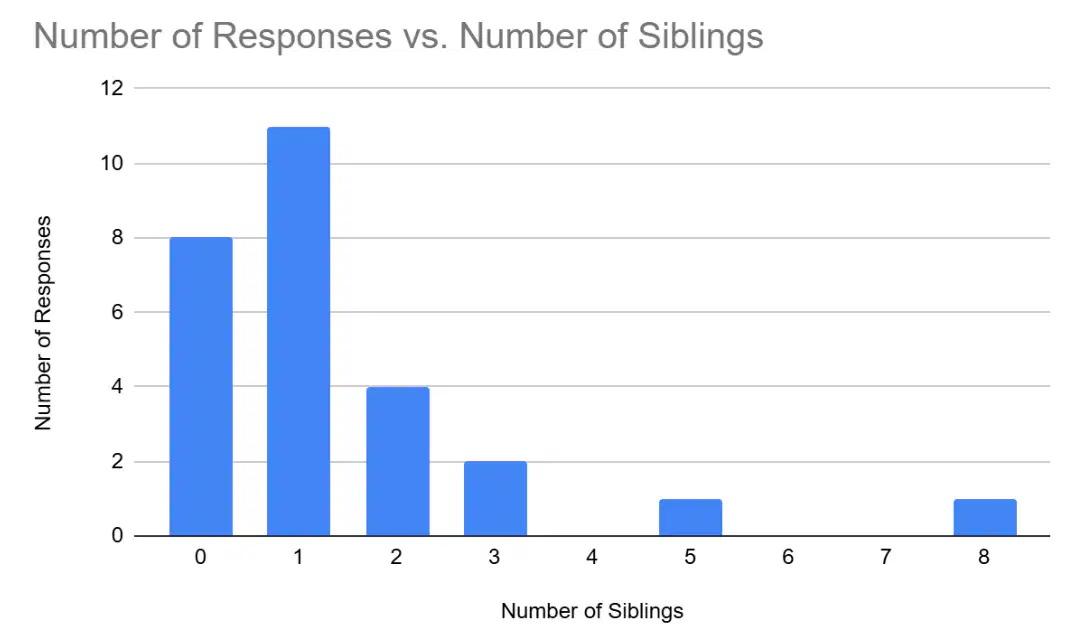
TPS.75
What is the mean value of this data?
1.4
1.8
1
6

TPS.76
How many people have two or less books in their desk?

TPS.77
The graph shows the number of cars sold from January to April. How many more cars were sold in March than in January?
(a)
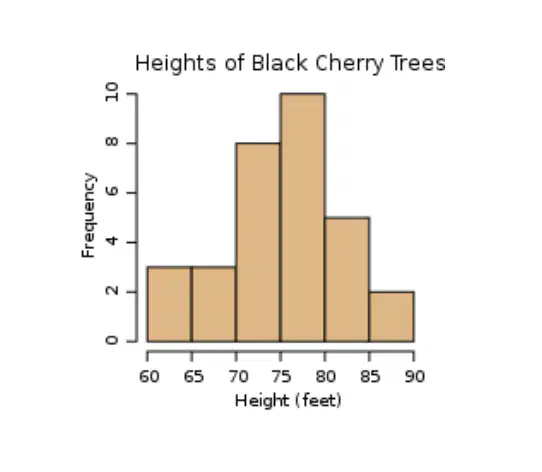
What is range of this data?
30 feet.
20 feet
10 feet
Not measurable

Kindly confirm that these insights are in your notes or that you already have them mastered by typing "Done"
(a)

S.1
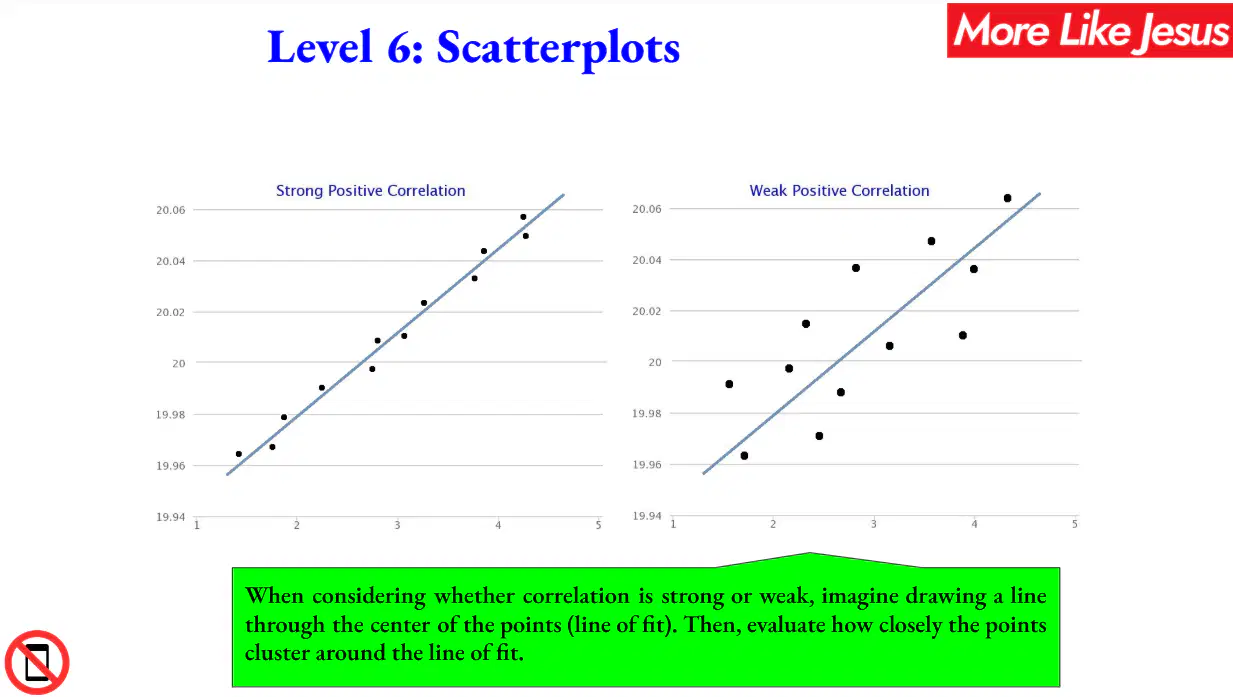
Kindly identify the correlation
Weak Positive
Strong Positive
Weak Negative
Strong Negative

S.2
Kindly identify the correlation
Weak Positive
Strong Positive
Weak Negative
Strong Negative

S.3
Kindly identify the correlation
Positive correlation
Negative correlation
No correlation

S.4
Kindly identify the correlation
No Correlation
Positive Correlation
Negative Correlation
Kindly confirm that these insights are in your notes or that you already have them mastered by typing "Done"
(a)

S.5
Kindly identify the correlation
Weak Positive
Strong Positive
Weak Negative
Strong Negative

S.6
Kindly identify the correlation
Weak Positive
Strong Positive
Weak Negative
Strong Negative

S.7
Kindly identify the correlation
Weak Positive
Strong Positive
Weak Negative
Strong Negative

S.8
Kindly identify the correlation
Weak Positive
Strong Positive
Weak Negative
Strong Negative

S.9
Kindly identify the correlation
No Correlation
Positive Correlation
Negative Correlation

S.10
Kindly identify the correlation
No Correlation
Positive Correlation
Negative Correlation

S.11
Kindly identify the correlation
No Correlation
Positive Correlation
Negative Correlation
Kindly confirm that these insights are in your notes or that you already have them mastered by typing "Done"
(a)

S.12
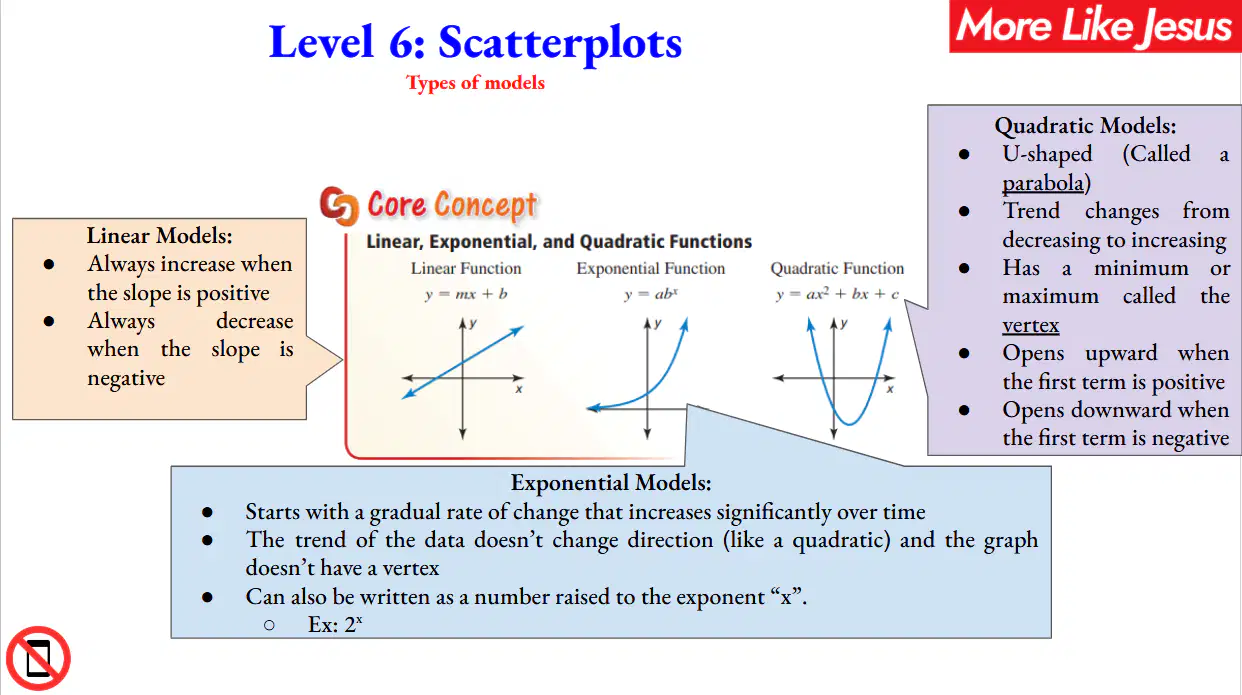
This is a _______________ function.
Linear
Exponential
Quadratic
S.13
Pick a function that best models the following situation: A babysitter getting paid hourly.

S.14
This is a ________________ function.
Linear
Exponential
Quadratic

S.15
This is a _______________ function.
Linear
Exponential
Quadratic

S.16
This is a _______________ function.
Linear
Exponential
Quadratic
S.17
y=x2
What type of equation is the above?
exponential
linear
quadratic
neither
S.17a
Is the equation linear, exponential, or quadratic?
y = 2x
Linear
Exponential
Quadratic
None of the above
S.18
Causation or Association:
The hotter the temperature of the oven, the less time needed to cook a turkey.
Ask: "Does the occurrence of the 1st statement cause the 2nd 99.999% of the time?"
Causation
Association
S.19
Causation or Association:
The more water in a teapot, the hotter the tea.
Ask: "Does the occurrence of the 1st statement cause the 2nd 99.999% of the time?"
Causation
Association
S.20
Causation or Association:
The more money I spend at the store, the less room I have in my freezer.
Ask: "Does the occurrence of the 1st statement cause the 2nd 99.999% of the time?"
Causation
Association
S.21
Causation or Association:
The more money I spend on clothes, the less money I have to spend on food.
Ask: "Does the occurrence of the 1st statement cause the 2nd 99.999% of the time?"
Causation
Association
S.22
Causation or Association:
The more my dog barks outside, the less birds are in my yard.
Ask: "Does the occurrence of the 1st statement cause the 2nd 99.999% of the time?"
Causation
Association
S.23
Causation or Association:
The more dogs in a dog park, the less dogs at the Petsmart.
Ask: "Does the occurrence of the 1st statement cause the 2nd 99.999% of the time?"
Causation
Association
S.24
Causation or Association:
The more hours I work, the more money I earn.
Ask: "Does the occurrence of the 1st statement cause the 2nd 99.999% of the time?"
Causation
Association
S.25
Causation or Association:
The more money I earn, the more problems I have.
Ask: "Does the occurrence of the 1st statement cause the 2nd 99.999% of the time?"
Causation
Association
S.28
Pick a function that best models the following situation: The height of a rollercoaster from start to finish.
S.29
Pick a function that best models the following situation: The flu virus in a high school.
Exponential
Linear
Quadratic
Neither

S.30
What is the correlation between length of running start and distance of jump?

S.31
Based on the scatterplot, what is the best prediction of the average number of hours a person spends at work every week, if that person spends an average of 10 hours on recreational activities every week?

S.32
Based on the scatterplot, about how much money would a group of 10 people be expected to spend on food and beverages at this restaurant?

S.33
Based on this scatterplot, approximately what score would a student with 6 absences expect to receive on the final exam?


S.35
If the debate team plans to practice for 6 hours, how many debates should they win?

S.36
The following scatter plot shows the weights and lengths of some dinosaurs. Which statement accurately describes the information?

S.37
The scatter plot shows the relationship between the number of chapters and the total number of pages for several books. Use the trend line to predict how many chapters would be in a book with 180 pages.

S.38
Predict the grade of a student that has 7 absences.

S.39
What is the best prediction for the number of candies in the jar when 30 students visit her?

S.40
If Joe worked 30 hours, how much is he expected to earn?

S.41
Make a prediction for a resting heart rate after 6 hours of exercise a week.

S.42
Phil collected data from several of his friends about the number of hours they spent sleeping and the number of hours they spent playing video games on Saturday. He recorded the data in the scatterplot. Based on the scatterplot, what is the best prediction of the number of hours one of Phil's friends spends sleeping when the friend spends 1 hour playing video games?
9 hours
10 hours
7 hours
8 hours

S.43
Students in a science class investigated how the speed of changes with the air temperature outside. The data is shown in the scatterplot. Based on the scatterplot, what is the best prediction of the speed of sound when the air temperate is 50 degrees C?
350 m/s
355 m/s
360 m/s
380 m/s

S.44
The scatterplot shows the number of people in each of 8 different households and the average amount of money each household spent on groceries. Based on the scatterplot, what is the best prediction of the average amount of money spent on groceries for a household that has 7 people?
$240
$190
$210
$300

S.45
The scatterplot shows the average number of hours each of 13 people spends at work every week and the average number of hours each of them spends on recreational activities every week. Based on the scatterplot, what is the best prediction of the average number of hours a person spends at work every week if that person spends an average of 10 hours on recreational activities each week?
33 h
85 h
50 h
65 h

S.46
Students in a group of chess teams submitted data about hours of team practice and the number of matches the team won. The graph shows the results of the data. Based on the linear regressions equation y = 3.14x + 3.52, if a team practices 4.5 hours per week next year, which is the best prediction of the number of chess matches a team could expect to win?

S.47
As the age of the car increases, its value decreases. Which scatterplot represents this relationship?

S.48
Mrs. Collins made a scatterplot to show the relationship between the number of absences and a student’s final exam score. Based on this scatterplot, a student with 12 absences should get approximately what score on the final exam?
60
92
70
76

S.49
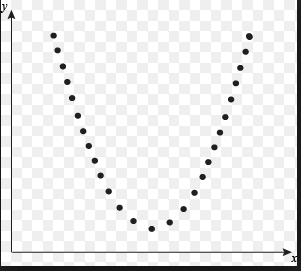
Which scatter plot shows a linear relationship between x and y?
S.50
What type of association does this scatter plot represent?
S.51
What type of correlation (association)?
The outside temperature and the amount of layers you wear.
S.52
The number of siblings you have and your weight.

S.53
About how many male math teachers were there in 2006?

S.54
A small theme park is trying to determine the number of guests they should expect on a weekend, based on the temperature outside. Based on the trend line, about how many guests should be expected if the temperature is around 80°?
S.55
If two quantities A and B exhibit a negative correlation, then as quantity A increases, quantity B would . . .?
stay the same
increase
decrease
S.56
If two quantities A and B exhibit a positive correlation, then as quantity A increase quantity B would . . .?
increase
decrease
stay the same

S.57
The following scatter plot shows Pam's training as she prepares to run a 6 mile race at the end of the month. Which of the following would be a reasonable approximation for the length of time it would take for her to run 6 miles?

S.58
If Gold's Gym paid $250 for each TV, how many did they buy?
S.59
What is the correlation between length of running start and distance of jump?
S.60
Make a prediction for a resting heart rate after 6 hours of exercise a week.

S.61
The scatter plot below shows the number of books read by students in Mrs. Hall’s English class and their final grades. Which statement represents the best description about the line of best fit?
S.63
Students in a science class investigated how the speed of changes with the air temperature outside. The data is shown in the scatterplot.
Based on the scatterplot, what is the best prediction of the speed of sound when the air temperate is 50 degrees C?
350 m/s
362 m/s
358 m/s
348 m/s
S.64
The scatterplot shows the number of people in each of 8 different households and the average amount of money each household spent on groceries.
Based on the scatterplot, what is the best prediction of the average amount of money spent on groceries for a household that has 7 people?
$240
$190
$210
$285

