
 Worksheets
Correlations
Total questions: 25
Worksheet time: 25mins
Which best describes what 'correlations' are?
a method where participants' behaviour are directly observed by resarchers
a method which involves participants directly reporting answers to questions
a method to show the relationship between co-variables

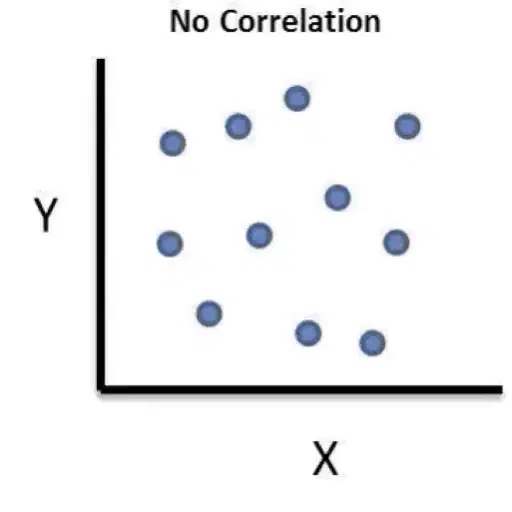
Which type of correlation does C show?
Positive correlation
Negative correlation
No correlation
Which type of correlation does A show?
Positive correlation
Negative correlation
No correlation
The more track athletes practice, the less time it takes them to finish the race.
Positive correlation
Negative correlation
No correlation
A measure of the extent to which two factors vary together, and thus of how well either factor predicts the other. The mathematical expression of the relationship, ranges from -1 to +1
scatterplot
survey
correlation
observation
case study
The principle in this method is that some variables co-vary-that is, when one variable changes, the other variable changes as well.
co-parent variables
correlational studies
field experiment
lab experiment
When two variables increase and decrease together.
Strong Correlation
Positive Correlation
Negative Correlation
Weak Correlation
Variable 1: Amount of fried chicken eaten (in ounces) Variable 2: Feelings of fullness (self-assessed on a 1-10 scale) Between these two variables, there is probably
a positive correlation
a negative correlation
no correlation
an illusory correlation
A positive r-value shows a positive correlation.
True
False
This correlation coefficient indicates no correlation at all.
(a)
What is the primary aim of a correlational study?
To determine cause and effect
To investigate the relationship between co-variables
To test the effectiveness of an intervention
To explore participants' subjective experiences
A scattergraph with points forming an upward trend indicates:
Negative correlation
Positive correlation
No correlation
Curvilinear correlation
What kind of graph is a visual tool used in correlation studies to display the relationship between two co-variables?
(a)
Which of the following is an example of a positive correlation?
The more you study, the lower your grades.
The less exercise you do, the fitter you are.
The taller a person is, the larger their shoe size.
The more you eat, the fewer calories you consume.
Which of the following best describes a negative correlation?
A) Both variables increase together
B) One variable increases while the other decreases
C) Both variables decrease together
D) No relationship between variables
In a study, it was found that as the number of hours spent on social media increases, the quality of sleep decreases. This is an example of:
A) Positive correlation
B) Negative correlation
C) No correlation
D) Causal relationship
What does a correlation coefficient of 0 indicate?
A) Strong positive correlation
B) Strong negative correlation
C) No correlation
D) Perfect correlation
Which of the following is an example of a spurious correlation?
A) Ice cream sales and drowning incidents
B) Height and weight
C) Study time and exam scores
D) Exercise and fitness level
What is the main limitation of correlational research?
A) It cannot determine causation
B) It is time-consuming
C) It requires a large sample size
D) It is expensive
If two variables have a correlation coefficient of -0.8, what can be inferred?
A) Strong positive correlation
B) Weak positive correlation
C) Strong negative correlation
D) No correlation
Which statistical tool is commonly used to calculate the correlation between two variables?
A) T-test
B) Chi-square test
C) Pearson's correlation coefficient
D) ANOVA
In a correlational study, what does a scatterplot with a downward trend indicate?
A) Positive correlation
B) Negative correlation
C) No correlation
D) Perfect correlation
Which of the following scenarios is likely to show no correlation?
A) Amount of rainfall and umbrella sales
B) Shoe size and intelligence
C) Temperature and ice cream sales
D) Study time and grades
What is the range of values for a correlation coefficient?
A) 0 to 1
B) -1 to 1
C) -2 to 2
D) 0 to 100
Which of the following best describes a perfect positive correlation?
A) Correlation coefficient of 0
B) Correlation coefficient of 1
C) Correlation coefficient of -1
D) Correlation coefficient of 0.5

