
 Worksheets
Understanding Sets and Notation
Total questions: 140
Worksheet time: 1hrs 10mins
What is a set?
A random collection of objects
A well-defined group of objects
A group of mixed items with no specific criteria
Any collection of numbers only
What is the correct term for the objects in a set?
Factors
Components
Elements
Variables
Which of the following sets is not well-defined?
The set of prime numbers less than 10
The set of vowels in the English alphabet
The set of beautiful flowers
The set of primary colors
What symbol is used to represent that an element belongs to a set?
∉
∩
⊆
∈
Which of the following best describes a well-defined set?
A collection of items that have a clear membership rule
A random list of items
A collection of numbers only
A group of objects chosen by preference
If A = {2, 4, 6, 8}, which of the following is true?
3 ∈ A
6 ∈ A
9 ∈ A
10 ∈ A
Which of the following sets is represented correctly using the Roster Method?
A = { x | x is an even number }
B = {a, e, i, o, u}
C = { x | x is a natural number less than 5 }
D = { x | x is a city in the Philippines }
Convert the verbal description into the Roster Method: "The set of months in a year that start with J."
{June, July, January}
{January, July, June}
{January, June, July, September}
{June, July, August}
If B = {x | x is a multiple of 3, x < 10}, what is the roster notation of B?
{3, 6, 9}
{1, 2, 3}
{3, 6, 9, 12}
{0, 3, 6, 9, 12}
Identify the correct Set-Builder Notation for the set A = {1, 3, 5, 7, 9}.
A = {x | x is an even number}
A = {x | x is an odd number less than 10}
A = {x | x is a prime number less than 10}
A = {x | x is a whole number}
Which of the following is not an example of a set?
The set of all positive integers
The set of delicious foods
The set of Philippine presidents
The set of colors in a rainbow
If A = {1, 2, 3, 4} and B = {2, 3, 4, 5}, which element is in both sets?
1
2
5
6
Which of the following best illustrates the importance of well-defined sets in real life?
Listing favorite movies of people
Grouping people by their preference of food
Classifying numbers into even and odd
Naming the most fun places to visit
Identify the error in this set notation: A = {x | x is a natural number less than 0}
There are no natural numbers less than 0
The set should be written using roster notation
The set is infinite
The set is correct
Create a set using the Set-Builder Notation for the set of all vowels in the English alphabet.
{x | x is a vowel in the English alphabet}
{a, e, i, o, u}
{x | x is a consonant}
{x | x is a letter in the alphabet}
What is the correct notation for the cardinality of a set A?
|A|
∅
A ⋃ B
A ⊆ B
If A = {1, 2, 3, 4}, what is |A|?
2
3
4
Infinite
What is the universal set in a given problem?
The set containing all elements being considered
The set with no elements
The largest set in the world
A subset of another set
Identify the finite set from the following options:
The set of counting numbers
The set of all real numbers
The set of months in a year
The set of stars in the universe
Which set represents an infinite set?
The set of letters in the alphabet
The set of prime numbers
The set of colors in the rainbow
The set of vowels in the English language
What is the correct subset of B = {3, 6, 9}?
{3, 9, 12}
{3, 6}
{3, 5}
{1, 2, 3}
Which of the following is not a proper subset of A = {2, 4, 6}?
{2, 4}
{4, 6}
{2, 4, 6}
{ }
Given the sets A = {1, 2, 3, 4} and B = {3, 4, 5, 6}, what is A ⋂ B?
{1, 2}
{3, 4}
{5, 6}
{1, 2, 3, 4, 5, 6}
Given A = {2, 4, 6, 8} and B = {1, 3, 5, 7}, what is A ⋃ B?
{ }
{1, 3, 5, 7}
{2, 4, 6, 8}
{1, 2, 3, 4, 5, 6, 7, 8}
If C = {x | x is an even number} and D = {x | x is a multiple of 5}, what is C ⋂ D?
{10, 20, 30, ...}
{5, 15, 25, ...}
{2, 4, 6, 8}
{ }
Which of the following statements is false?
An empty set is a subset of every set.
A universal set contains all elements being considered.
A proper subset has at least one element less than the original set.
The intersection of two disjoint sets is the universal set.
What can be concluded if A ⋂ B = Ø?
A and B are disjoint sets.
A is a subset of B.
A and B are equal sets.
A and B have common elements.
Which statement about cardinality is correct?
The cardinality of an infinite set is a finite number.
The empty set has a cardinality of 1.
The set {1, 2, 3, 4, 5} has a cardinality of 5.
The set of prime numbers has a cardinality of 0.
Create a Set-Builder Notation for the set {10, 20, 30, 40, 50}.
{x | x is a prime number}
{x | x is a multiple of 10, x ≤ 50}
{x | x is an even number}
{x | x is a number greater than 50}
Which real-world scenario best represents an intersection of sets?
People who like either basketball or volleyball
Students who take both Math and Science
A library with different book genres
A menu with various food options
Given U = {1, 2, 3, 4, 5, 6, 7, 8, 9, 10}, and A = {1, 3, 5, 7, 9}, what is A' (complement of A)?
{1, 3, 5, 7, 9}
{2, 4, 6, 8, 10}
{ }
{1, 2, 3, 4, 5, 6, 7, 8, 9, 10}
Which set notation correctly represents the union of two sets?
A ⋂ B
A ⋃ B
A ⊆ B
|A|
Given X = {a, b, c, d, e} and Y = {c, d, e, f, g}, which elements belong to X ⋂ Y?
{a, b, c, d, e}
{c, d, e}
{f, g}
{ }
What is the symbol used for the set of natural numbers?
𝕎
ℕ
ℤ
ℚ
Which subset of real numbers includes zero and all positive integers?
Whole numbers (𝕎)
Natural numbers (ℕ)
Rational numbers (ℚ)
Irrational numbers (ℚ′)
What type of numbers can be expressed as fractions (p/q) where q ≠ 0?
Integers (ℤ)
Rational numbers (ℚ)
Irrational numbers (ℚ′)
Whole numbers (𝕎)
Which of the following is an irrational number?
1/2
0.333...
√2
-3
What is the union of rational (ℚ) and irrational numbers (ℚ′)?
ℕ
ℤ
ℝ
∅
Which of the following is not a rational number?
3.75
7/2
π (pi)
-4
Which number belongs to both the set of integers (ℤ) and rational numbers (ℚ)?
√5
3/4
-7
π
What is the intersection of natural numbers (ℕ) and irrational numbers (ℚ′)?
ℕ
ℚ
ℝ
∅
Given the sets A = {1, 2, 3, 4} and B = {3, 4, 5, 6}, what is A ⋃ B?
{3, 4}
{1, 2, 3, 4, 5, 6}
{5, 6}
∅
Given C = {x | x is a rational number} and D = {x | x is an integer}, what is C ⋂ D?
{x | x is an irrational number}
{x | x is an integer}
{x | x is a whole number}
{x | x is a fraction}
Which statement is true about real numbers?
The set of rational numbers is a subset of irrational numbers.
The union of rational and irrational numbers is the set of real numbers.
Natural numbers include all integers.
The intersection of rational and irrational numbers is the set of integers.
What is (ℕ ⋃ ℤ) ⋂ ℚ′?
{x | x is a natural number}
{x | x is an integer}
{x | x is an irrational number}
∅
Which number can be found in whole numbers (𝕎), integers (ℤ), and rational numbers (ℚ)?
-3
1/3
0
π
If U = {real numbers}, and A = {rational numbers}, what is the complement of A (A′)?
{x | x is an integer}
{x | x is an irrational number}
{x | x is a real number}
{x | x is a fraction}
What is the correct Set-Builder Notation for the set of all negative integers?
{x | x > 0, x ∈ ℤ}
{x | x < 0, x ∈ ℤ}
{x | x is a fraction}
{x | x is a whole number}
Create a Set-Builder Notation for the set {2, 4, 6, 8, 10}.
{x | x is an even number, x ≤ 10}
{x | x is a prime number}
{x | x is a rational number}
{x | x is a fraction}
What real-world example best represents a subset relationship?
A school with different clubs
A collection of books in a library
The set of students taking Science and those taking Math
The set of cars and the set of electric cars
Given U = {all numbers}, and A = {even numbers}, what is the complement of A (A')?
{all even numbers}
{all odd numbers}
{all whole numbers}
{all real numbers}
Which set notation correctly represents the union of two sets?
A ⋂ B
A ⋃ B
A ⊆ B
|A|
Given X = {a, b, c, d, e} and Y = {c, d, e, f, g}, which elements belong to X ⋂ Y?
{a, b, c, d, e}
{c, d, e}
{f, g}
{ }
Why is data considered crucial in decision-making processes?
It eliminates the need for intuition.
It provides objective evidence to support conclusions.
It complicates the analysis process.
It reduces the need for expert opinions.
Which of the following best describes the role of data in research?
Data is used to prove hypotheses without analysis.
Data serves as the foundation for validating hypotheses.
Data is secondary to theoretical assumptions.
Data is only useful for qualitative studies.
How does data contribute to business growth?
By increasing operational costs.
By providing insights into customer behavior and market trends.
By complicating decision-making processes.
By limiting the scope of market analysis.
Which of the following is an example of qualitative data?
The temperature of a room.
The color of a car.
The height of a building.
The weight of an object.
Quantitative data is characterized by:
Descriptions and characteristics.
Numerical measurements and counts.
Subjective interpretations.
Open-ended responses.
In a survey, respondents are asked to rate their satisfaction on a scale from 1 to 5. This type of data is:
Qualitative.
Quantitative.
Neither qualitative nor quantitative.
Both qualitative and quantitative.
Which of the following is an example of nominal data?
Rankings in a competition.
Blood types of individuals.
Number of students in a class.
Height measurements of individuals.
Ordinal data is best described as:
Data with a true zero point.
Data that can be categorized and ranked.
Data that cannot be ordered.
Data representing distinct categories without any order.
The number of cars passing through a toll booth in an hour is an example of:
Nominal data.
Ordinal data.
Discrete data.
Continuous data.
Which of the following represents continuous data?
Shoe sizes.
Number of books on a shelf.
Time taken to complete a task.
Types of fruits in a basket.
Which data collection method involves gathering information through direct questioning of participants?
Observation.
Experimentation.
Survey.
Case study.
A focus group discussion (FGD) is primarily used to:
Collect numerical data from a large population.
Explore in-depth perspectives on a specific topic.
Conduct experiments in a controlled environment.
Observe behaviors without participant interaction.
In which data collection method does the researcher manipulate variables to determine cause-and-effect relationships?
Survey.
Interview.
Experimentation.
Observation.
A case study is best described as:
A quantitative analysis of a large sample.
An in-depth examination of a single subject or group.
A method involving structured questionnaires.
A technique for observing natural behaviors.
What is the primary difference between a population and a sample?
A population is a subset of a sample.
A sample includes all members of a population.
A population includes all members of a defined group, while a sample is a subset of the population.
There is no difference; the terms are interchangeable.
Why do researchers often use samples instead of entire populations?
Sampling is less time-consuming and more cost-effective.
Populations provide more accurate data.
Samples are always more reliable than populations.
Populations are too small to study effectively.
In simple random sampling:
Every member of the population has an equal chance of being selected.
Samples are chosen based on the researcher's judgment.
Participants are selected based on convenience.
The population is divided into subgroups, and samples are taken from each.
Systematic sampling involves:
Selecting every nth member from a list of the population.
Dividing the population into clusters and randomly selecting clusters.
Choosing participants based on specific characteristics.
Randomly selecting individuals without any specific pattern.
Which sampling technique divides the population into subgroups and selects samples from each subgroup?
Cluster sampling.
Stratified sampling.
Convenience sampling.
Systematic sampling.
Convenience sampling is characterized by:
Random selection of participants.
Selection of participants who are easiest to reach.
Dividing the population into clusters and sampling each.
Ensuring every member of the population has an equal chance of selection.
Which of the following best defines a frequency distribution table?
A chart that displays data points in a time sequence.
A table that lists data values and their corresponding frequencies.
A graph that shows the relationship between two variables.
A diagram that represents data through sectors of a circle.
What is the primary purpose of constructing a frequency distribution table?
To calculate the median of the dataset.
To organize data for easier interpretation and analysis.
To determine the correlation between variables.
To display data in a three-dimensional format.
Given the dataset: [5, 7, 5, 9, 7, 5], what is the frequency of the value '7'?
1
2
3
4
Which of the following datasets is most appropriate for an ungrouped frequency distribution table?
Ages of 1,000 participants in a marathon.
Test scores of 30 students in a class.
Daily temperatures recorded over a year.
Annual incomes of residents in a city.
When constructing a grouped frequency distribution table, how is the class width determined?
By subtracting the smallest data value from the largest and dividing by the number of desired classes.
By counting the total number of data points.
By adding the highest and lowest data values.
By multiplying the number of classes by the range of the data.
Why might a researcher choose to use a grouped frequency distribution table instead of an ungrouped one?
To increase the precision of data values.
To simplify the representation of large datasets.
To highlight individual data points.
To avoid any data categorization.
In a grouped frequency distribution table, what does the term 'class interval' refer to?
The difference between the highest and lowest data values.
The range of values within a specific category.
The total number of data points.
The midpoint of a dataset.
Given a dataset with a range of 50 and a desired number of 5 classes, what should be the class width?
5
10
15
20
Which of the following is a characteristic of an ungrouped frequency distribution table?
Data is divided into intervals.
Each individual data value is listed separately.
It is used for large datasets with a wide range of values.
Frequencies are not displayed.
How does the choice of class intervals affect the interpretation of a grouped frequency distribution table?
Wider intervals provide more detailed information.
Narrower intervals can obscure overall trends.
The number and width of intervals can influence the clarity and insight of data patterns.
Class intervals have no impact on data interpretation.
If a dataset contains the values [12, 15, 12, 18, 20, 15, 12], what is the mode?
12
15
18
20
In a frequency distribution table, what does the cumulative frequency represent?
The total number of data points.
The sum of frequencies up to a certain class or value.
The difference between consecutive frequencies.
The average frequency of all classes.
Which graphical representation is most appropriate for displaying a grouped frequency distribution?
Line graph
Pie chart
Histogram
Scatter plot
Consider a dataset with the following values: [4, 8, 6, 5, 3, 7, 9]. If you were to create a frequency distribution table with class intervals of width 2, starting at 3, which class interval would contain the value '6'?
3 - 4
5 - 6
6 - 7
7 - 8
Why is it important to ensure that class intervals in a grouped frequency distribution table are mutually exclusive?
To allow data points to fall into multiple classes.
To prevent overlap and ensure each data point is counted only once.
To increase the number of classes.
To simplify the table construction process.
Given a frequency distribution table, how would you calculate the relative frequency of a class?
Divide the class frequency by the total number of classes.
Subtract the class frequency from the total number of data points.
Divide the class frequency by the total number of data points.
Multiply the class frequency by the class width.
If two datasets have identical frequency distribution tables, what can be inferred about their data distributions?
The datasets have the same mean and median.
The datasets have identical individual data points.
The datasets share the same distribution pattern, though individual data points may differ.
The datasets have the same range but different variances.
How can the shape of a histogram provide insights into the nature of the data distribution?
It reveals the exact data values.
It shows the cumulative frequencies.
It illustrates the distribution pattern, such as skewness or symmetry.
It displays the correlation between variables.
Which of the following statements is true about similar figures?
They have the same size but different shapes.
They have the same shape but not necessarily the same size.
They have equal perimeters.
They have equal areas.
In similar triangles, the corresponding angles are:
Congruent
Supplementary
Complementary
Equal to 90 degrees
If two rectangles are similar and the length of one side of the first rectangle is 8 cm while the corresponding side of the second rectangle is 12 cm, what is the ratio of their corresponding sides?
2:3
3:2
1:2
2:1
Two similar triangles have a scale factor of 3:5. If the area of the smaller triangle is 27 cm², what is the area of the larger triangle?
45 cm²
75 cm²
60 cm²
25 cm²
A 6-foot-tall person casts a shadow that is 9 feet long. At the same time, a nearby tree casts a shadow that is 24 feet long. How tall is the tree?
12 feet
16 feet
18 feet
20 feet
Which of the following statements is true about a subset?
Every subset is equal to its superset.
A subset must contain more elements than its superset.
A subset can have fewer elements than the original set.
A subset can never be equal to the original set.
If Set A = {1, 2, 3} and Set B = {1, 2, 3, 4, 5}, which of the following is true?
Set A is a subset of Set B.
Set B is a subset of Set A.
Set A and Set B are equal.
Set A is not related to Set B.
Which set is a subset of {a, b, c, d}?
{a, b, c, d, e}
{a, b, c}
{e, f}
{c, d, e}
What is the union of Set X = {2, 4, 6} and Set Y = {4, 6, 8}?
{2, 4, 6}
{4, 6}
{4, 6, 8}
{2, 4, 6, 8}
What is the union of Set X = {2, 4, 6} and Set Y = {4, 6, 8}?
{2, 4, 6}
{4, 6}
{4, 6, 8}
{2, 4, 6, 8}
Which of the following represents the union of {1, 5, 7} and {3, 5, 9}?
{1, 3, 7, 9}
{1, 3, 5, 7, 9}
{5}
{5, 7, 9}
If Set C = {x, y} and Set D = {y, z}, what is C ∪ D?
{x, y}
{y, z}
{x, y, z}
{x, z}
What is the intersection of Set M = {a, b, c} and Set N = {b, c, d}?
{a, b, c, d}
{b, c}
{a, d}
{}
The intersection of {2, 4, 6, 8} and {3, 6, 9} is:
{2, 4, 8}
{3, 9}
{6}
{}
If Set E = {p, q, r} and Set F = {r, s, t}, what is E ∩ F?
{p, q, r, s, t}
{r}
{p, q}
{s, t}
Which operation will result in a set containing all elements that are either in Set G or Set H, but not both?
Intersection
Union
Symmetric Difference
Difference
If Set I = {3, 5, 7} and Set J = {5, 7, 9}, which of the following represents I ∩ J?
{3, 9}
{3, 5, 7, 9}
{5, 7}
{9}
Which of the following operations on sets results in an empty set when the sets are disjoint?
Union
Intersection
Symmetric Difference
Complement
If Set K = {a, b} and Set L = {b, c}, what is K ∪ L?
{a, b, c}
{b}
{a, c}
{a, b}
The union of two identical sets, Set M and Set N, will result in:
An empty set
Set M
Set N
A set with all unique elements of both M and N
What is the intersection of Set P = {10, 20, 30} and Set Q = {20, 30, 40, 50}?
{10, 40}
{20, 30}
{30, 50}
{10, 20, 30, 40, 50}
Given Sets R = {1, 2, 3} and S = {2, 3, 4}, what is the result of R ∪ S?
{1, 4}
{1, 2, 3, 4}
{2, 3}
{3, 4}
If Sets T = {a, b, c} and U = {c, d, e} are combined using union, what is the resulting set?
{a, b, c, d, e}
{c}
{a, b, e}
{b, d}
How would you describe the intersection of Set V = {x, y, z} and Set W = {y, z, a}?
It contains all elements of V and W.
It is empty.
It contains elements common to V and W.
It contains elements unique to V.
Which set operation would you use to find elements that are in both Set X = {m, n, o} and Set Y = {n, o, p}?
Union
Intersection
Difference
Symmetric Difference
What is the symmetric difference of Set A = {1, 2, 3} and Set B = {2, 3, 4}?
{1, 4}
{2, 3}
{1, 2, 3, 4}
{1, 2, 4}
Which of the following represents a set with no elements?
Universal set
Null set
Subset
Cardinality
Which operation combines all elements from two sets without repetition?
Union
Intersection
Difference
Subset
Which operation compares finds the common elements between two sets?
Union
Intersection
Difference
Cardinality
What is the difference between a subset and a universal set?
A subset is a set with no elements, while a universal set contains all possible elements.
A subset is a set that is smaller size compared to another set, while a universal set is infinitely large.
A subset contains only elements that are also in another set, while universal set includes all possible elements.
A subset represents a specific category of elements, while a universal set represents a general category.
What does the overlapping region in Venn Diagram represent?
Elements that are only in Set A.
Elements that are only in set B.
Elements that are common to both set A and set B.
Elements that are not present in either set A or set B.
Which of the following sets is represented correctly using the Roster Method?
A = { x | x is an even number }
B = {a, e, i, o, u}
C={x|x is a natural number less than 5}
D={x|x is a city in the Philippines}
Identify the finite set from the following options:
The set of counting numbers
The set of all real numbers
The set of months in a year
The set of stars in the universe
Given the sets A = {1, 2, 3, 4} and B = {3, 4, 5, 6}, what is A ‚A⋂B?
{1, 2}
{3, 4}
{5, 6}
{1, 2, 3, 4, 5, 6}
Which subset of real numbers includes all positive and negative integers, including zero?
Natural numbers
Whole numbers
Integers
Rational numbers
What is the symbol used for the set of natural numbers?
W
N
Z
Q
Qualitative data describes qualities, characteristics, or categories and cannot be measured in numbers. Which of the following is an example of qualitative data?
The temperature of a room.
The color of a car.
The height of a building.
The weight of an object.
Nominal data is a categorical data with no specific order or ranking. Which of the following is an example of nominal data?
Rankings in a competition.
Blood types of individuals.
Number of students in a class.
Height measurements of individuals.
A focus group discussion (FGD) is primarily used to:
Collect numerical data from a large population.
Explore in-depth perspectives on a specific topic.
Conduct experiments in a controlled environment.
Observe behaviors without participant interaction.
Convenience sampling is characterized by:
Random selection of participants.
Selection of participants who are easiest to reach.
Dividing the population into clusters and sampling each.
Ensuring every member of the population has an equal chance of selection.
In a survey, respondents are asked to rate their satisfaction on a scale from 1 to 5. This type of data is:
Qualitative.
Quantitative.
Neither qualitative nor quantitative.
Both qualitative and quantitative.
Systematic sampling involves selecting every nth member of a population after arranging them in a specific order. Which of the following is NOT an example of systematic sampling?
A researcher wants to check the current condition of houses in a housing project area. He creates a list of all residents and inspects every 15th house on the list.
A librarian wants to check the condition of books in a library. She lists all 1,000 books in order and inspects every 10th book on the list.
A researcher wants to understand household electricity usage in a city. She randomly selects 5 barangays and surveys every household in those barangays.
A health worker wants to monitor a hospital ward’s patient satisfaction. She selects every 4th patient on the list of admitted patients for the day.
How does systematic sampling differ from simple random sampling?
It involves selecting every nth item from a list
It requires the division of populations into strata
It results in more biased samples
It uses a lottery method for selection
Which of the following best defines a frequency distribution table?
A chart that displays data points in a time sequence.
A table that lists data values and their corresponding frequencies.
A graph that shows the relationship between two variables.
A diagram that represents data through sectors of a circle.
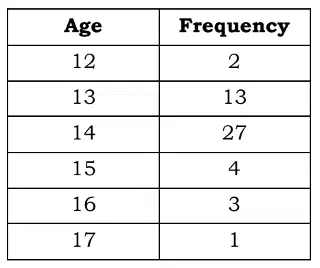
What is the total frequency of the given data?
30
40
45
50
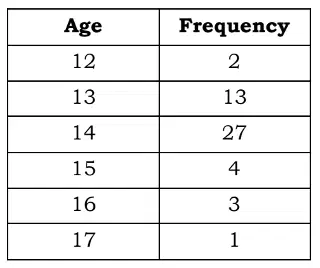
How many students enrolled in Mathematics have an age of 15?
3
4
13
27
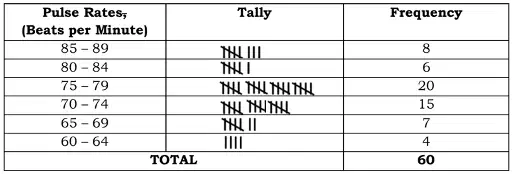
What is the most common number of beats per minute?
80 - 84
75 - 79
70 - 74
65 - 69
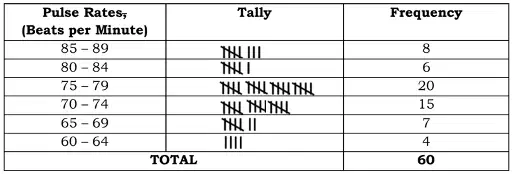
How many people had pulse rates of 80 and higher?
2
6
8
14
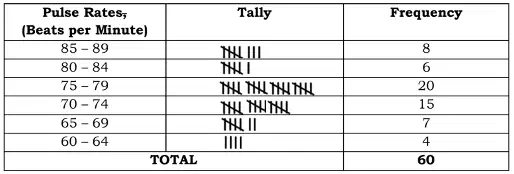
How many people had pulse rate of 70 and below?
4
7
15
26

