
 Worksheets
Limiting Factors + Exemplar 6A
Total questions: 45
Worksheet time: 1hrs 14mins
What is one effect of more food being available in an ecosystem?
Decrease in reproduction rates
More organisms can live there
Animals must move or die
Decrease in plant growth
What happens to plants when water is more available?
They produce less food
They grow and produce more food
They go dormant
They die
How do parasites typically affect organisms?
They kill them immediately
They weaken them without killing in most cases
They make them stronger
They have no effect
What is the effect of less food availability on animals?
Animals reproduce more
Animals must move or die
Animals grow larger
Animals become stronger
How does habitat destruction affect populations?
Always beneficial
Always harmful
No effect
Sometimes beneficial
What is the result of poaching or illegal hunting on populations?
Increase populations
Decrease populations
No effect on populations
Stabilize populations
According to predator-prey graphs, what happens when there is more prey?
The number of predators decreases
The number of predators increases
The number of prey decreases
The number of prey remains the same
What is the effect of invasive species on other populations?
They increase other populations
They decrease other populations
They have no effect on other populations
They stabilize other populations
What is the likely outcome if the prey population becomes too large?
Predator population will decrease
Predator population will increase
Prey population will decrease
Prey population will remain constant
How do predators affect the population of their prey?
Decrease prey population
No effect on prey population
Stabilize prey population
Increase prey population
Which of the following would cause greater devastation to a large population of squirrels than that of a small population?
major flooding
weather changes
infectious diseases
forest fires

Rainbow trout is a native species to the lake, while Asian carp is an invasive (exotic) species that was introduced to the ecosystem by humans.
Based on the data in the table, which of the following is the most likely prediction about the populations in the year 2015?
A. The Asian carp will continue to out compete the rainbow trout, and reduce the trout population to approximately 1,000.
B. The Asian carp will continue to out compete the rainbow trout, and reduce the trout population to approximately 100,000.
C. The rainbow trout will continue to out compete the Asian carp, and increase the trout population to approximately 1,000,000.
D. The rainbow trout will continue to out compete the Asian carp, and increase the trout population to approximately 10,000,000.
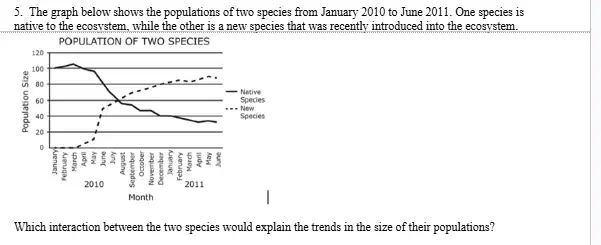
The graph below shows the populations of two species from January 2010 to June 2011. One species is native to the ecosystem, while the other is a new species that was recently introduced into the ecosystem.
The two species form a mutualistic relationship (both organisms benefit).
The two species form a competitive relationship.
The new species is a host and the native species is its parasite.
The new species is a prey and the native species is its predator.

4, 1, 2, 3
1, 4, 2, 3
1, 4, 3, 2
2, 3, 1, 4
Factors that limit the growth of a population are called?
Carrying Capacity
Limiting Factors

What happens to the rabbit population on year 4?
It begins to decrease
It stays the same
It increases
It reaches carrying capacity

Which statement best describes Which statement best explains what is happening to the rabbit population after it levels off near 1000?
A. The rabbits stop reproducing because they reached their maximum age.
B. The rabbit population reached its carrying capacity due to limited food and space.
C. The rabbit population will continue to increase with no limits.
D. The rabbit population was replaced by a new species.
A
B
C
D

Where on the graph have the limiting factors began to affect the the population growth?
A
B
C


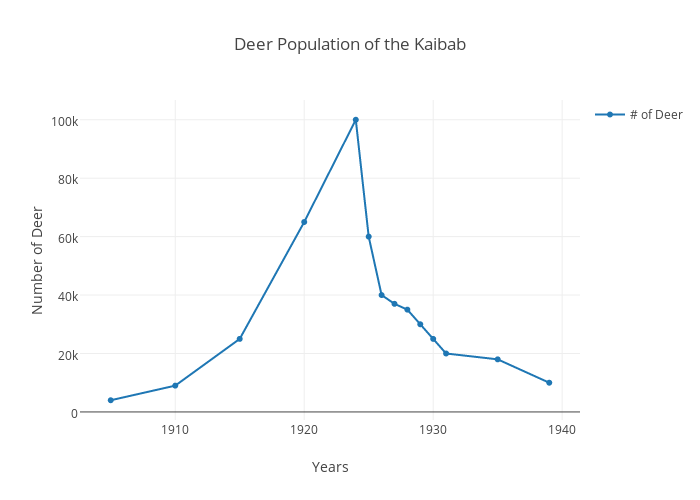
According to the graph, what is causing the deer population to decrease
They got sick
The wolf population is decreasing
The wolf population increased
They ran out of food

Click on the picture of the graph. What is this graph showing?
Lynx and hare populations over time
Lynx and hare captures over time
Lynx and hare offspring over time
Lynx and hare speed over time

Snowshoe hare populations typically increase first. Choose the statement that would BEST explain why.
The snowshoe hares increase when more Canadian lynx prey on them
The snowshoe hares increase because more plants grow in the summer for them to eat
The snow shoe hares increase because they cannot survive the harsh winters

Which pattern is found in the graph?
The populations do not show a similar pattern
The populations cycle opposite of each other about every 10 years. When one increases, the other decreases
The populations cycle with each other about every 10 years. When one increases, the other also increases

At the end of the graph, the Canadian lynx population starts to decline. What do you predict will happen to the snowshoe hare population following the decline of their predator?
The snowshoe hare population will most likely increase.
The snowshoe hare population will most likely decrease.

What would happen to the moose population if wolves were removed?
remain the same
moose population would increase
moose population would decrease
Identify factors that would influence the moose population?
wolf population
tick infestation
mild winters
abundant winter forage

Predator population lags behind prey population because:
Increase in predators leads to decrease in prey
Increase in predators leads to increase in prey
Increase in predators leads to decrease in producers


_________________ is something that scientists use to represent an idea or explanation.
A question
A claim
A model
A theory
SC.6.N.3.1
Which phrase defines a scientific theory?
a. an untested idea
b. an educated guess
c. an accepted description
d. a well-supported explanation
a
b
c
d

SC.7.N.3.2
Two types of models that can be used to show details of the structures of cells are shown. Which of the following describes a limitation of the drawing but NOT the clay model?
a. It does not represent the main parts of a cell.
b. It does not contain the correct number of nuclei.
c. It cannot represent a living cell, since a true cell is three-dimensional.
d. It cannot represent a living cell, since the cytoplasm should be in constant motion.
a
b
c
d

SC.7.N.3.1
Over time, scientists’ ideas about the structure of atoms have changed. Historic and current models of the atom are shown below. What must happen for the current model to continue to be accepted?
a. Experimental evidence will need to continue to provide evidence for the current model.
b. Scientific opinion will need to continue to support the current model of the atom.
c. Scientists will need to build better microscopes so they can examine atoms more closely.
d. Experimental evidence will need to provide evidence that the other models are not accurate.
a
b
c
d
If something new is discovered in science, what will most likely happen?
The scientific knowledge may change as long as there is empirical evidence to support it.
Science will be called inaccurate and untrustworrthy.
The scientists that discovered the new information will be fired from their research positions.
None of the above.
How can we collect empirical evidence?
Through our own personal beliefs and bias
Through experimentation, investigations, and observations.
Predictions from only mathematical models.
Predictions from only 3-D physical models.
What is empirical evidence used for by scientists?
To support explanations, test predictions, build models, and create new questions
To memorize facts only
To ignore observations
To make random guesses
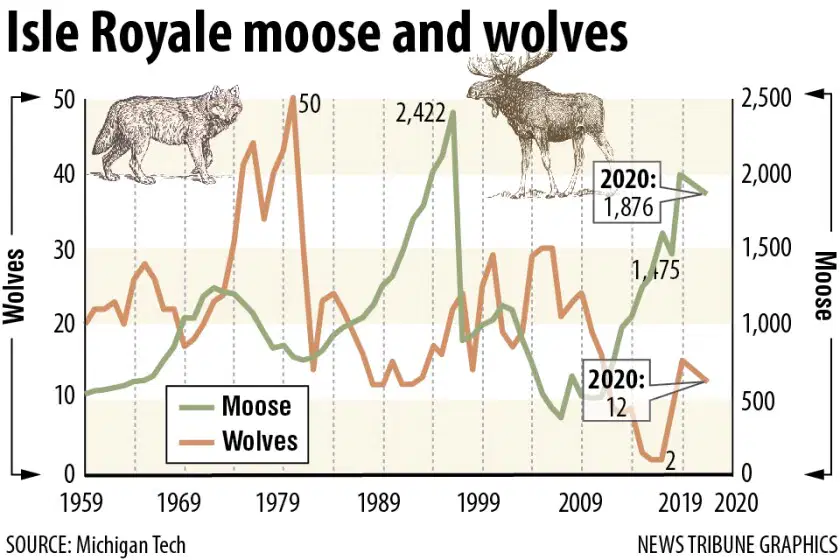
If a new food source were introduced for the moose on Isle Royale, what would likely happen to the moose population?
A) The moose population would decrease because they have more food
B) The moose population would increase because they have more food
C) The moose population would stay the same
D) The wolf population would immediately disappear
A
B
C
D
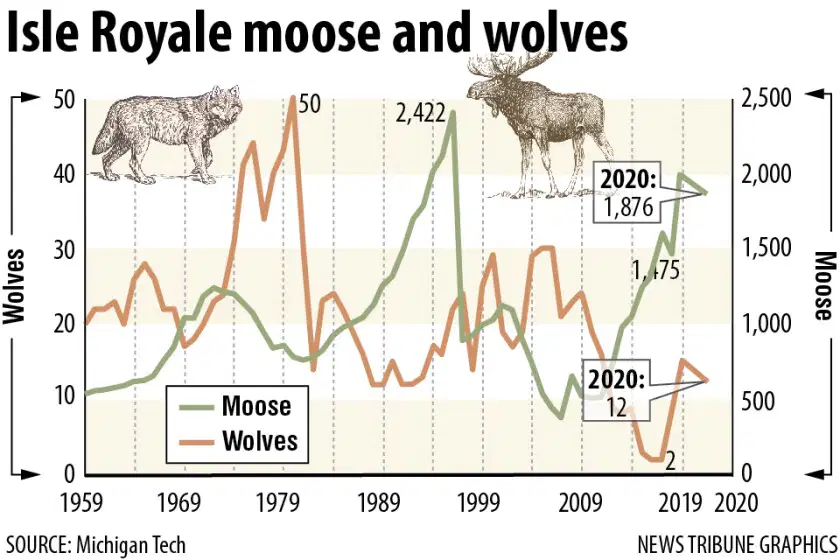
Looking at the Isle Royale wolves and moose graph, what happens first in a typical population cycle?
A) The wolf population increases, then the moose population decreases
B) The moose population increases, then the wolf population increases
C) The moose population decreases, then the wolf population increases
D) The wolf population stays the same while the moose population decreases
A
B
C
D
A company is planning to build a new factory that uses fresh water pumped from a river to cool its machines while they operate. The company plans on constructing the new factory near an estuary. The freshwater used by the factory will be cooled back to outside temperatures and then released into the estuary. An estuary is a partially enclosed, coastal water body where freshwater from rivers and streams mixes with salt water from the ocean
Which limiting factor in the estuary would be affected by the building of this new factory?
Sunlight penetration
Salt levels in the water
Nutrient levels in the soil
Temperature of the water

