
 Worksheets
UNIT 8- A.6A, A.7A
Total questions: 65
Worksheet time: 5hrs 25mins

Label the Graph with the Correct Key Features.
1. (a) 2. (b)
3. (c) 4. (d)


A quadratic function is graphed on the grid.
Which answer choice best represents the domain and range of the function?
Domain: x≥−3
Range: y≥5
Domain: All real numbers
Range: y≥5
Domain: x≥−3 Range: All real numbers
Domain: y≥5
Range: x≥−3
What is the range of y=−x2−2x+3 ?
x≤4
x≥−4
y≤4
y≥−4

The graph shown represents a quadratic function. Determine which key features correctly represent the function. Select all that apply.
maximum value: −1
minimum value: −1
vertex: (1, −1)
Axis of symmetry: x=1
Axis of symmetry: x=−1
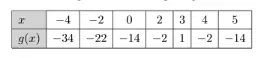
What is the range of g?
A. All real numbers
B. All real numbers less than or equal to 1
C. All real numbers less than or equal to -22
D. All real numbers greater than or equal to 0
What is the range of y = -x² + 2x - 9?
x ≤ -9
x ≤ -8
y ≤ -9
y ≤ -8
What are the domain and range of f(x) = 5x² + 4?
Domain: All real numbers Range: f(x) ≥ 4
Domain: x ≥ 0 Range: f(x) ≥ 4
Domain: All real numbers Range: x ≥ 0
Domain: f(x) ≥ 4 Range: x ≥ 0
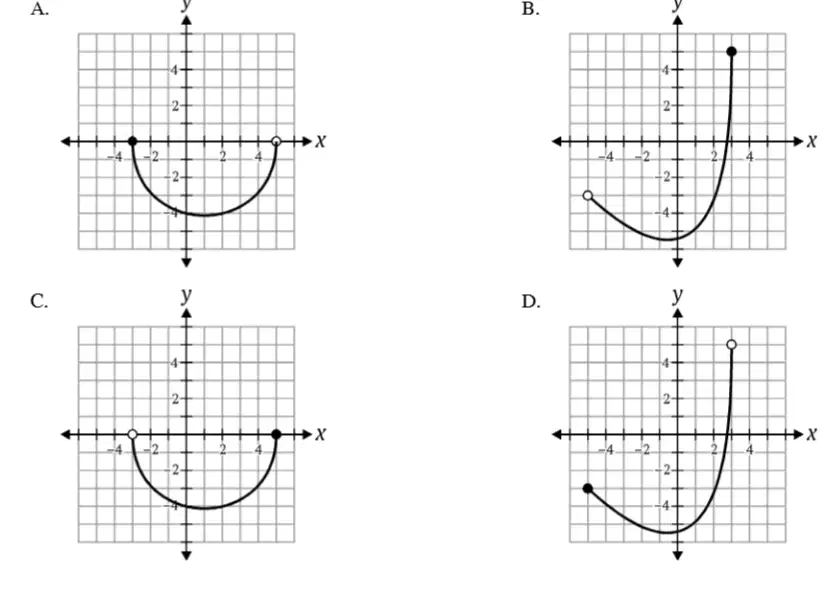
Which graph represents a function with a domain of all real numbers greater than or equal to -3 and less than 5?
A
B
C
D

Which graph represents a function with a range of all real numbers greater than -2 and less than 3?
A
B
C
D
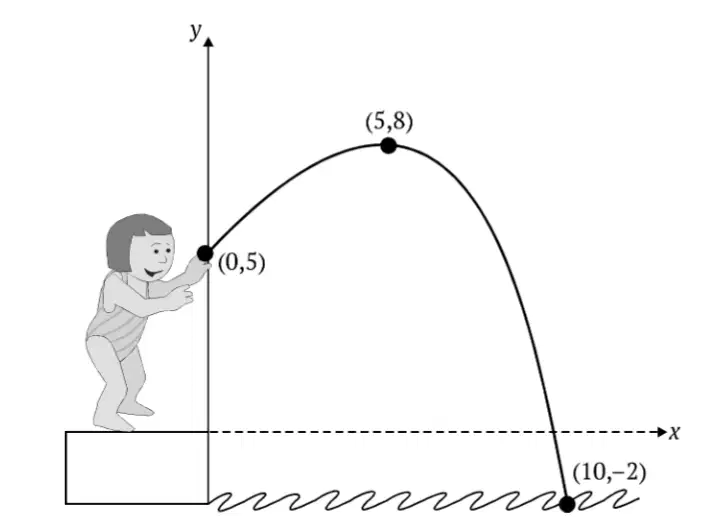
A student stood at the edge of a swimming pool and threw a ball into the water. The graph shows the height in feet of the ball above the ground as a quadratic function of x, the horizontal distance in feet of the ball from the edge of the pool. What is the range of the function for this situation?
0 ≤ x ≤ 10
-2 ≤ y ≤ 5
0 ≤ y ≤ 10
-5 ≤ x ≤ 5
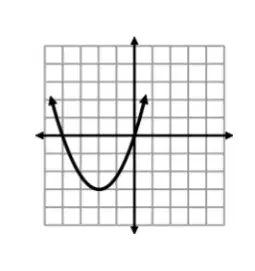
Which best describes the domain of the relation graphed?
{-4, 0}
-4 ≤ x ≤ 0
y ≥ -3
all real numbers
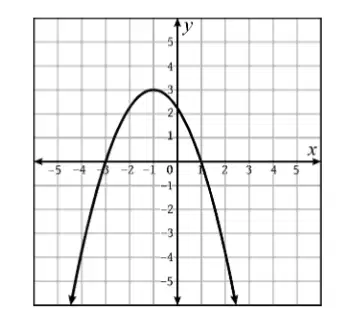
What is the range of the relation?
-3 ≤ y ≤ 1
y ≤ 3
{-3, 1}
all real numbers
What is the range of the relation?
-3 ≤ y ≤ 1
y ≤ 3
{-3, 1}
all real numbers

What is the domain of the function shown?
A. x ≥ -4
B. -4 < x < 6
C. {-4, -3, -2, -1, 0, 1, 2, 3, 4, 5, 6}
D. all real numbers
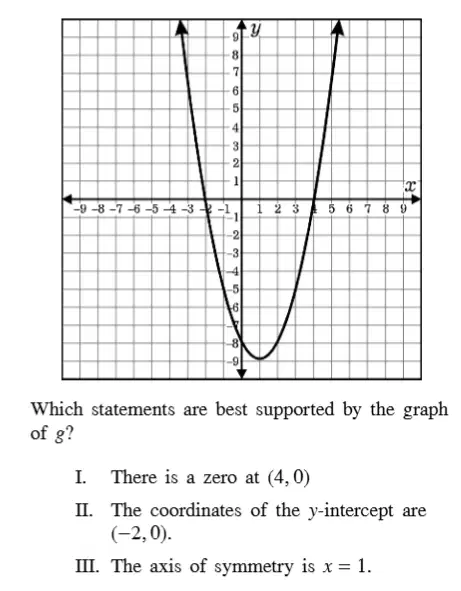
The graph of quadratic function g is shown on the grid. Which statements are best supported by the graph of g? I. There is a zero at (4, 0) II. The coordinates of the y-intercept are (−2, 0). III. The axis of symmetry is x = 1.
A. I and II only
B. I and III only
C. II and III only
D. I, II, and III

The graph of quadratic function m is shown on the grid. Which statements are best supported by the graph of m? I. The x-intercept is located at (−2, 0). II. The coordinates of the y-intercept are (0, 6). III. The axis of symmetry is y = 2.
I and II only
I and III only
II and III only
I, II, and III
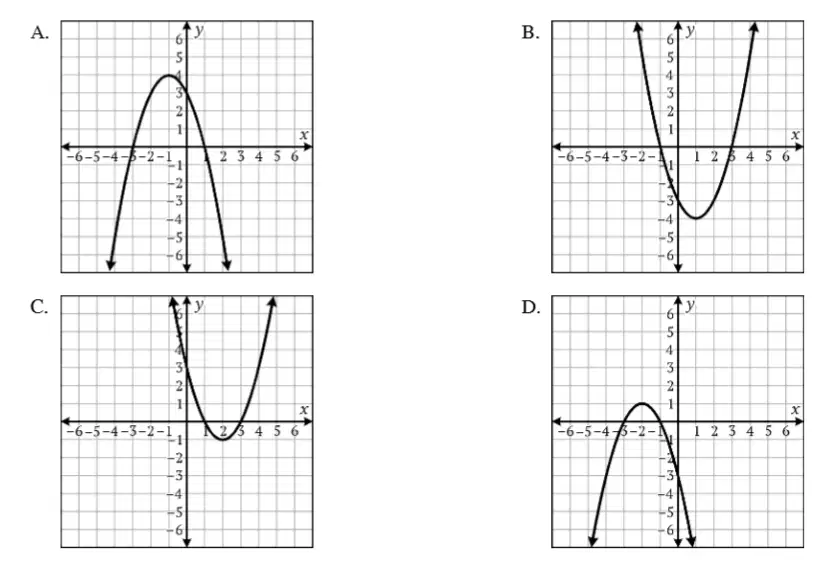
Which graph best represents y=x2−2x−3 ?
A
B
C
D
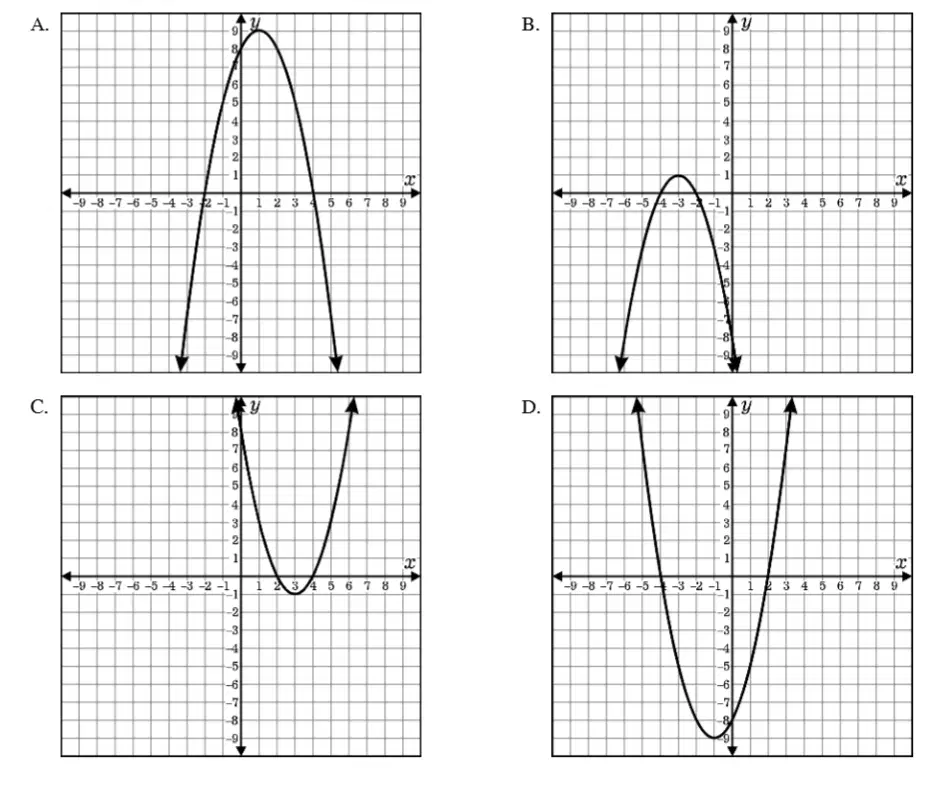
Which graph best represents −x2+2x+8 ?
A
B
C
D
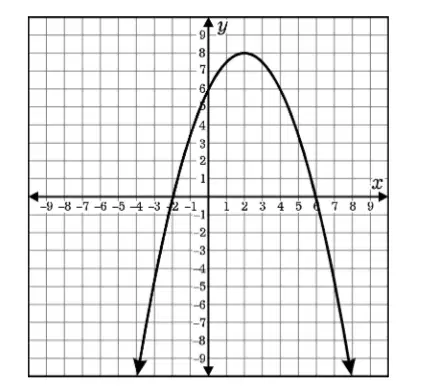
A graph of a quadratic function is shown. The vertex of the graph is best represented by which coordinates?
(0, 6)
(2, 8)
(−2, 0)
(6, 0)
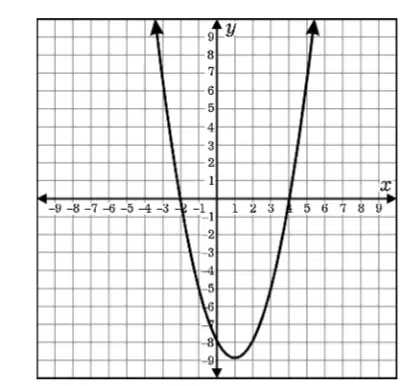
A graph of a quadratic function is shown. The vertex of the graph is best represented by which coordinates?
(0, −8)
(4, 0)
(−2, 0)
(1, −9)
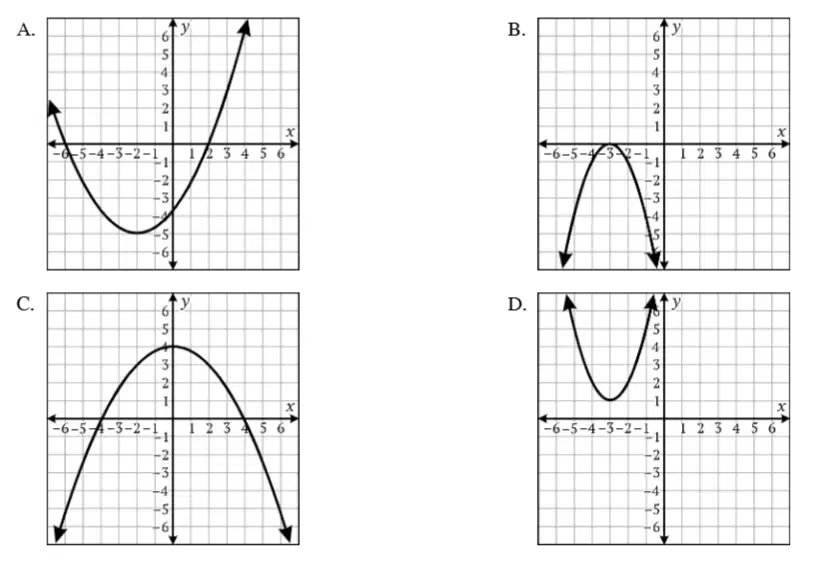
Which of the following quadratic functions has no zeros?
A
B
C
D

Which of the following quadratic functions has only one zero?
A
B
C
D
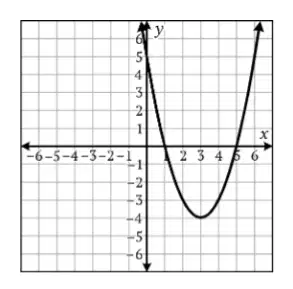
The graph of a quadratic function is shown on the grid. Which equation best represents the axis of symmetry?
y = -4
x = 3
y = 0
x = 6
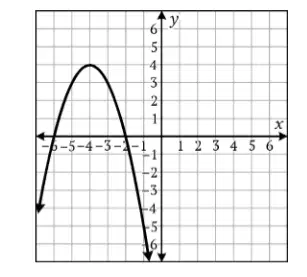
The graph of a quadratic function is shown on the grid. Which equation best represents the axis of symmetry?
y = 4
x = -1
y = -7
x = -4
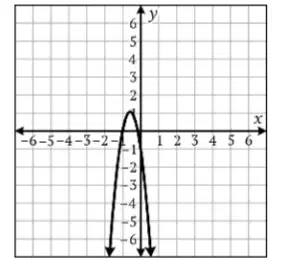
A graph of f(x)=−6x2−7x−1 is shown on the grid. What are the zeros of f ?
2 and -3
-1
−61 and -1
−31 and −23
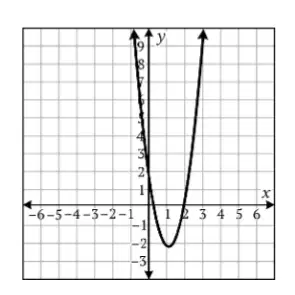
A graph of f(x)=3x2−7x+2 is shown on the grid. What are the zeros of f?
A. 2
B. 2 and 0
C. 31 and 2
D. 32 and 25
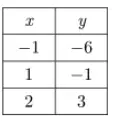
Which of the following tables corresponds to the function y=x2+3x−5 ?
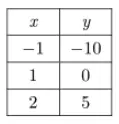
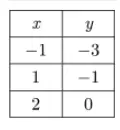
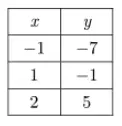
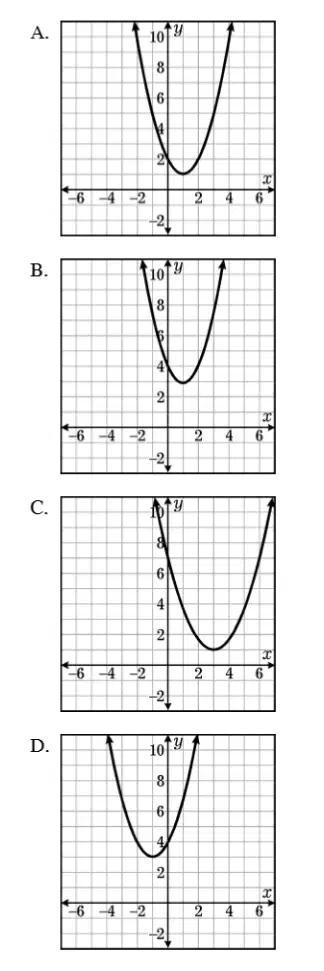
Which of the following graphs represents the equation y=x2−2x+4 ?
A
B
C
D

In the diagram, is the vertex a maximum or minimum point? What are the coordinates of the vertex?
minimum; (5, 3)
minimum; (-3, 5)
maximum; (5, -3)
minimum; (5, -3)
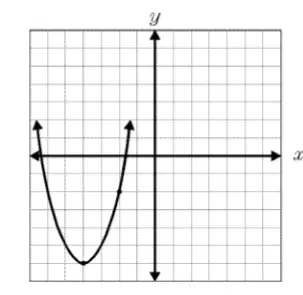
Is the vertex of the parabola shown in the graph a maximum or a minimum? What are the coordinates of the vertex?
minimum; (-6, -4)
maximum; (-4, -6)
minimum; (-4, -6)
maximum; (-6, -4)

Identify the y-intercept
(0, -3)
(0, 1)
(0, 3)
(2, 1)


Range : 0 ≤ y ≤ 4
Range : -2 ≤ y ≤ 2
Range : y ≤ 4
Range : y ≤ 4


What is the significance of the ordered pair (2, -4) to the graph?
It is the vertex
It is an x-intercept
It is the y-intercept
It is the axis of symmetry
What is the significance of the ordered pair (0, -2) to the graph?
It is the vertex
It is an x-intercept
It is the y-intercept
It is the axis of symmetry


What piece of information does c identify in the following equation?
y=ax2+bx+c
zeros
axis of symmetry
direction
y-intercept
Which graph shows y = x2 + 5x + 4 ?


Which graph shows y = x2 - 5x + 4 ?
Which graph shows y = x2 + 5x + 6 ?
Which graph shows y = x2 - 5x + 6 ?

Which of the following is equivalent to 3x-4y=6
Y=-6/7x
Y=-3/4x
Y=4/3x+2
Y=3/4x-3/2
Which graph can be used to find the solution to the system of equations below?
2x+y=-4
-3y=2x+12


The graph of the linear function f is shown on the grid. What is the zero of f?
Graph the linear function y = 5/4x + 3.
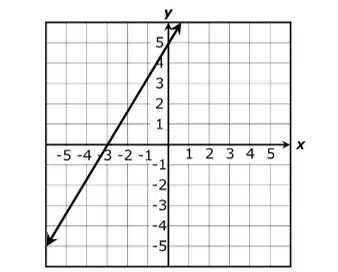
The graph of a function is shown on the grid. Which ordered pair best represents the location of the y-intercept?
A) (0, –3)
B) (0, 5)
C) (–3, 0)
D) (5, 0)
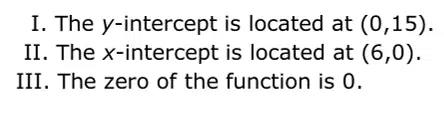
The graph of linear function k passes through the points (2, 10) and (4, 5). Which statements are best supported by the graph of k?
A) I and II only
B) I and III only
C) II and III only
D) I, II, and III
The graph of linear function k passes through the points (2, 10) and (4, 5). Which statements are best supported by the graph of k?
A) I and II only
B) I and III only
C) II and III only
D) I, II, and III
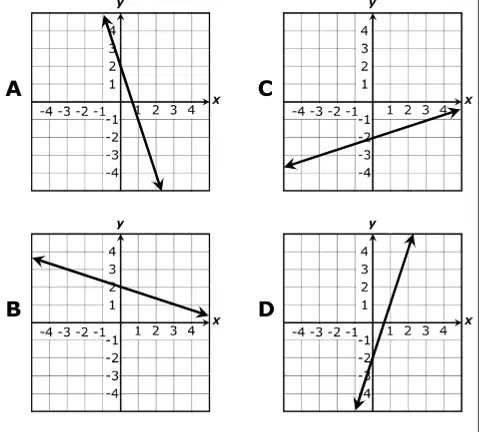
Which graph represents y = -1/3x + 2?
Graph A
Graph B
Graph C
Graph D
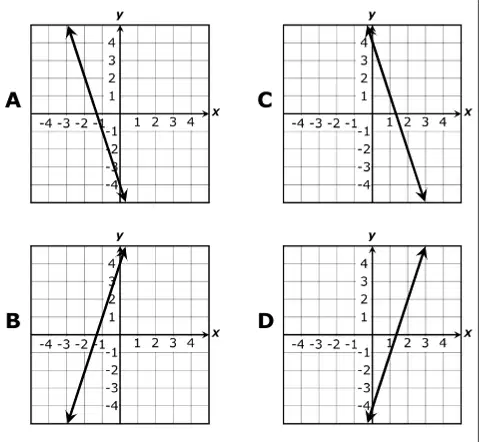
Which graph represents -7y = -21x + 28 ?
Graph A
Graph B
Graph C
Graph D

The table represents some points on the graph of a linear function. Which of the following statements are best represented by the linear function? (Select all that apply)
x-intercept: (6,0)
x-intercept: (0,6)
y-intercept: (0, −2)
slope: 31

The table represents some points on the graph of a linear function. Which of the following statements are best represented by the linear function? (Select all that apply)
zero: −3
y-intercept: (−12,0)
y-intercept: (0, −12)
slope: −4

The table represents some points on the graph of a linear function. Which of the following statements are best represented by the linear function? (Select all that apply)
x-intercept: (0,−12)
x-intercept: (−12,0)
y-intercept: (0, 6)
slope: 21
The graph of a linear function g passes through the points (−6, 14) and (6, −7) . Which of the following statements are best represented by the linear function? (Select all that apply)
x-intercept: (2,0)
x-intercept: (0,2)
y-intercept: (0, 3.5)
slope: −47

Damian borrowed money from a bank to buy a car. The table shows the loan balance, b(x) , after x monthly payments.
zero: 48
y-intercept: 1600
y-intercept: 48
slope: −350

