
 Worksheets
Statistics Charts and Graphs
Total questions: 28
Worksheet time: 27mins


Based on the data in the table, how many students played the three games that had the highest frequency?
62
57
60
61

The dot plot shows the number of books students in Mr. Stafford's class read during a summer reading contest. What fraction of the students in this class read four or more books?
eleven twenty-eighths
three sevenths
five fourteenths
three twenty-eighths

What fraction of the children are at least four years old?
9/25
3/8
1/3
1/6

How many more people voted for Garza than Price and Turner combined?
8
26
23
33

The bar graph shows data about the pets owned by math students in four classes. One bar is missing from the graph. If the students have a total of 32 dogs, which bar shows the number of dogs Ms. Davalos's class has?


Which month had the greatest number of books read?
November
December
January
February

Which month had the biggest difference between the high and low temperatures?
January
April
October
November

An outlier is..
a number that is repeated the most in the data.
a number that is the highest in the data.
a number that is the lowest in the data.
a number that is either much greater than or less than any other numbers in the data.


How many boys AND girls have shoes that are 20 centimeters long?
8
9
17
10

How many boys were surveyed?
20
29
30
35

Which continent has 36% of the wild cats?
Asia
Africa
North America
South America


Which day had more minutes of homework?
Wednesday
Thursday
Friday

How many votes did reading receive?
2
4
6
8
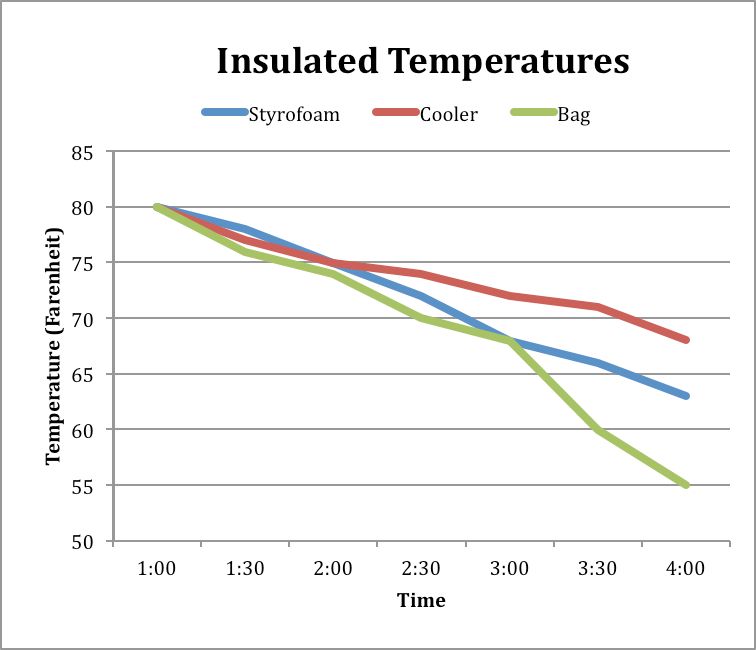
What data does this graph represent?
Change in temperature of a liquid over time in 3 different containers
How temperature can change the molecules in a material
The phase changes of a material
What type of container people use the most to store hot liquids.


