
 Worksheets
Statistics Revision
Total questions: 49
Worksheet time: 2hrs 3mins

How many strawberries does Ed have?
2
20
6
4

How many strawberries do Ed and George have together?
5
10
9
13

How many people voted for pepperoni as their favorite pizza?
6
15
30
20

How many apples were sold in January?
1
10
5
7

How may apples were sold in Feb and April?
4
60
6
40

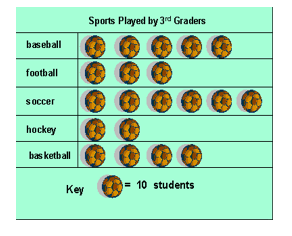
How many students liked basketball?
4
30
40
5
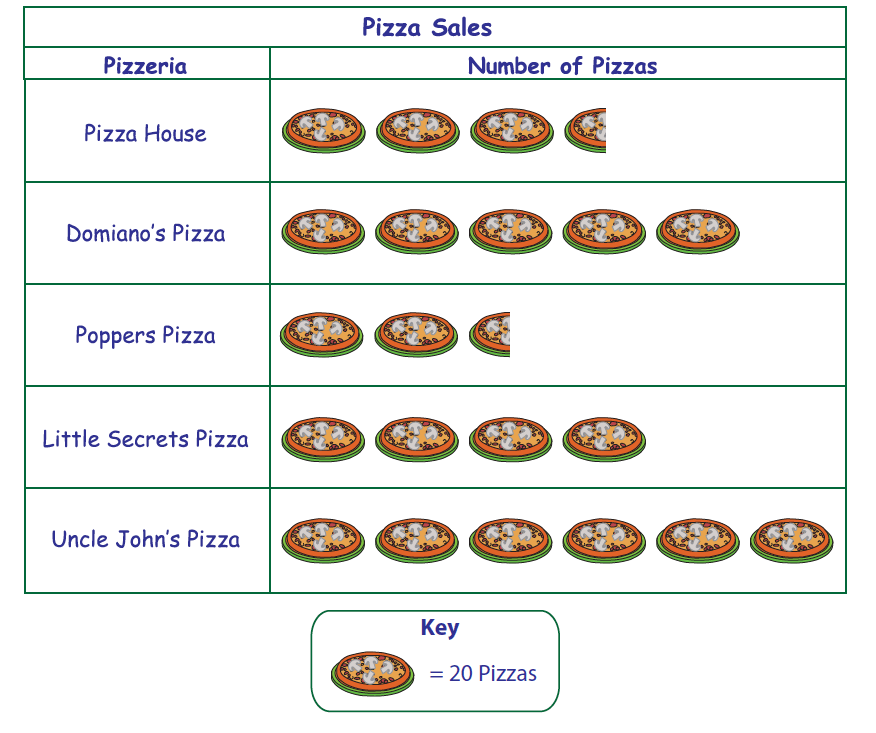
How many pizzas were sold by Peppers Pizza?
50
3
30
2 and a half

Which was the least favorite dinosaur?
T-rex
Velociraptor
Stegosaurus

What is the title of this column graph?
Wildlife
Orange and Blue
Dolphin Whales
Wildlife Population

What was the recorded population of dolphins in 2018?
60
78
110
65

What was the population of whales in 2019?
100
10
99
32

In what year was the highest population of whales recorded?
2017
2022
2019
2020
2021

In what year was the lowest population of whales recorded?
2017
2020
2019
2022
2018

In what year was the highest population of dolphins recorded?
2019
2020
2022
2017

The number of teachers at four schools are shown in the bar graph below. The number of teachers at school S is missing. There are a total of 56 teachers at schools S, T and V. Which bar graph represents the number of teachers at school S?





The mean is...
the middle
the average number (added together, then divided by the number of dots)
The most frequent number
The middle when in order


Numerical data is
•information that is conveyed in numerical form (uses numbers to answer questions).
data that is measurable, such as time, height, weight, amount, and so on.
Both answers are correct.
•Data could best be described as:
Collecting darts from the dartboard at the end of a game.
Finding useless information and saving it to your laptop.
Data is a collection of facts, such as numbers, words, measurements, observations or just descriptions of things.
Counting the number of rain drops falling from the sky.
Categorical data is
information that is grouped into categories, such as the colour of cars or favourite ice cream flavours.
cats choosing which mice to eat for breakfast.
the only form of data that should be used.
A line graph is...
used if you only have a pencil to draw your graph.
a graph that only ever uses one line because using more than one line would be confusing.
used to draw a line in the sand.
used to graph data that changes over time and they can also be used to compare two or more lots of data.

__________ use a line to connect data values.
Line graphs
Bar Graphs
Histograms
Pie charts

_________ are used for numerical data, splitting each number value into a stem part and a leaf part.
Pie Charts
Dot Plots
Stem and leaf plots
Tally Charts

12,10,10,10,13,12,11,13,10
20 30 40 50 60
3, 4, 5, 5, 5, 6, 7
The range of these numbers is
15
4
2
5

Liz read Island of the Blue Dolphins over spring break. The table shows how many pages she read on each day. Which bar graph represents the data in the table?


The table shows how third grade students voted in a survey that asked about their favorite breakfast cereal. Which bar graph represents the data in the frequency table?


How many Free throws were made in total?
42
32
14
148

How many people made 25 free throws?
1
2
3
0

What was the highest priced ticket?
$49
$409
$125
$402 689

How many crates of apples weighed 59kg?
1
2
3
0

What is the cost of the cheapest lunch?
35c
$3.05c
$35.00
$3.50

The diagram shows the ages of a group of people.
How many people are under 20?
4
5
3
8
The diagram shows the ages of a group of people.
How many people are there in the group?
44
29
12
16
The diagram shows the ages of a group of people.
How old is the youngest person in the group?
4
10
14
1

