
Font size
 Worksheets
Data Viz: Marks and Channels Quiz
Total questions: 12
Worksheet time: 6mins
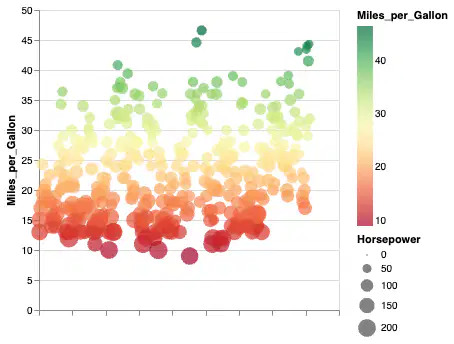
What is the mark used in this graph?
Circle
Bar
Line
Area
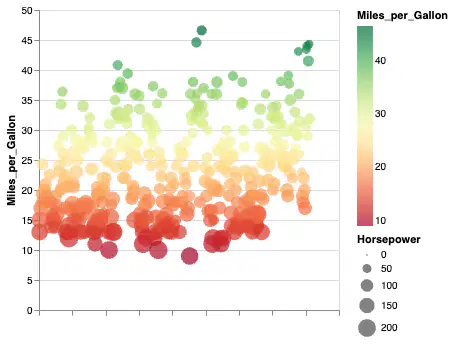
How many channels encode data in this chart?
1
2
3
4
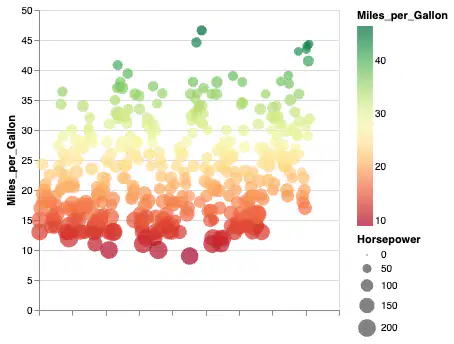
What channel(s) encode the miles per gallon (of a single data point - a car)?
The X axis
The Y axis
The X and Y axis
The X axis and color
The Y axis and color
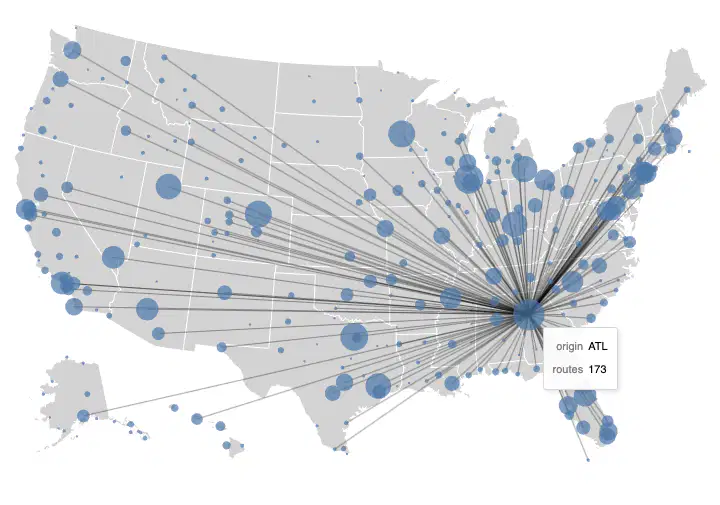
How many different types of marks are used in this chart?
1
2
3
4
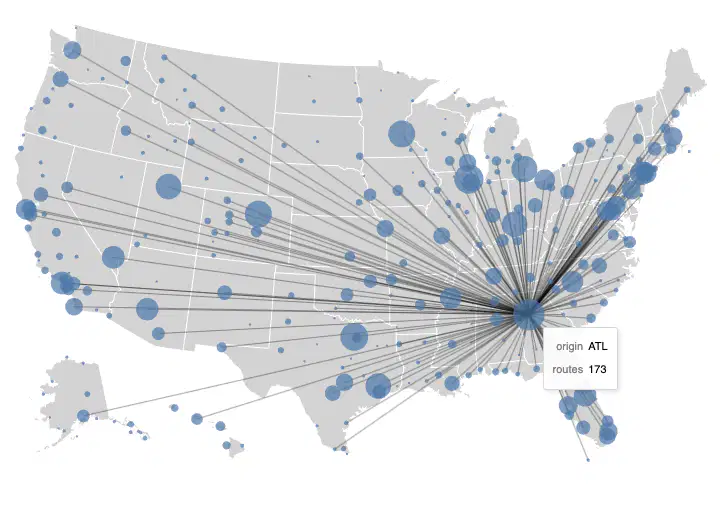
How were all these marks overlayed on top of one another? (altair code)
&
|
+
.hconcat()
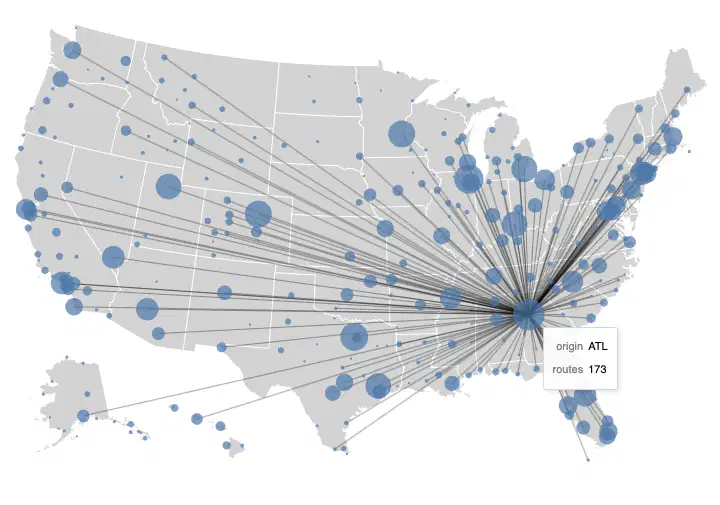
How many channels are encoded in the geoshape mark in this chart?
(a)
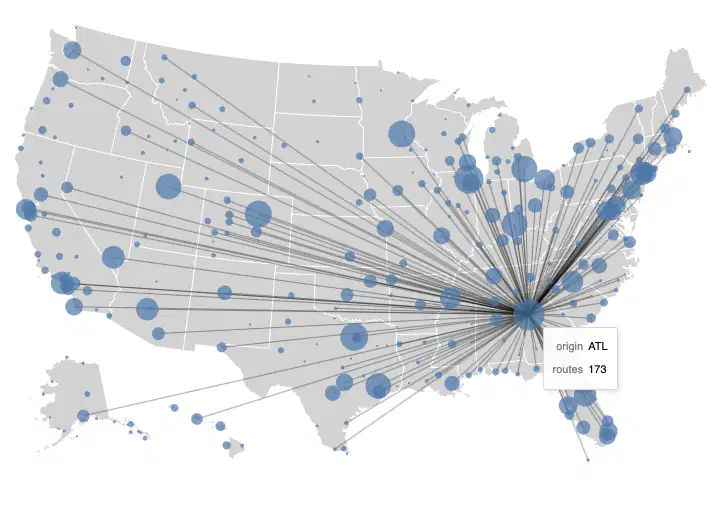
How many channels are encoded in the rule (the connections) mark of this chart?
1
2
3
4

How many different marks are used in this chart?
(a)
What channel is used for denoting literary theme?
Location (branch)
Color
Fan count
None of the above
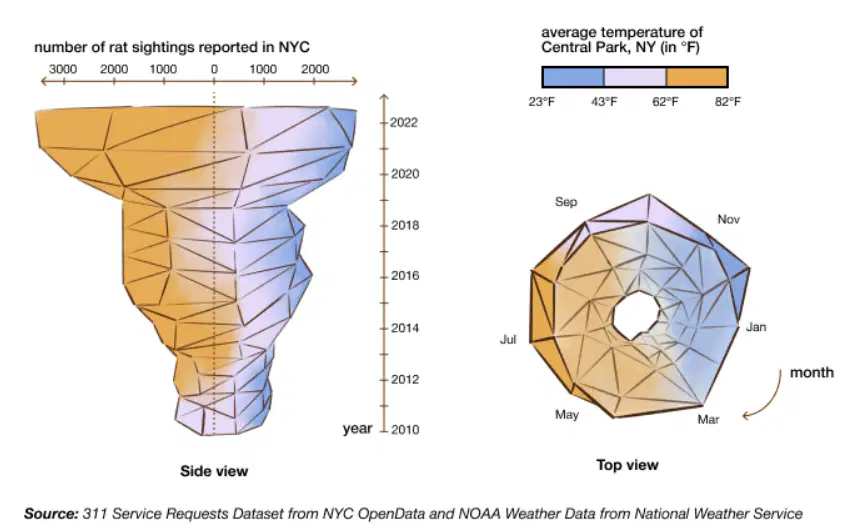
How many channels are used in this data visualization?
2
3
4
5
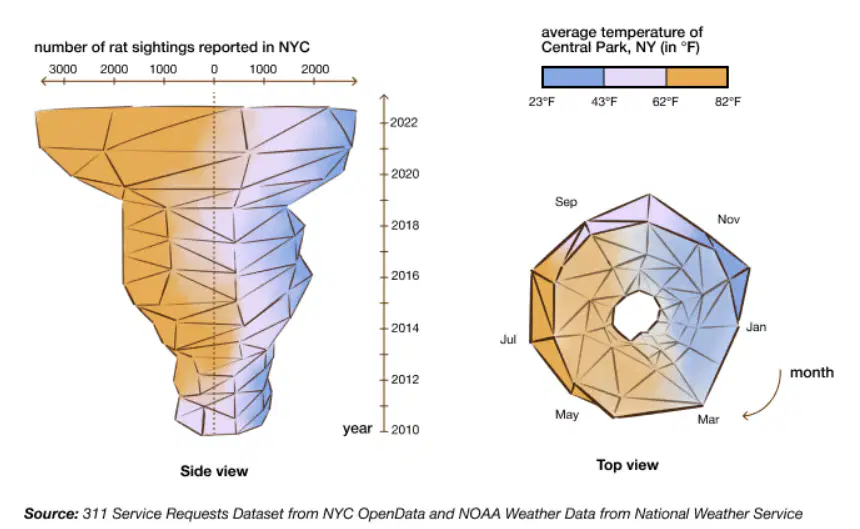
What does the y axis (different heights of the cone) represent?
How many rats spotted
Year
Time of year (Season)
Temperature
What does the angle of the cone represent?
How many rats spotted
Year
Time of year (Season)
Temperature

