
 Worksheets
Year End Science Test Part 1
Total questions: 36
Worksheet time: 18mins
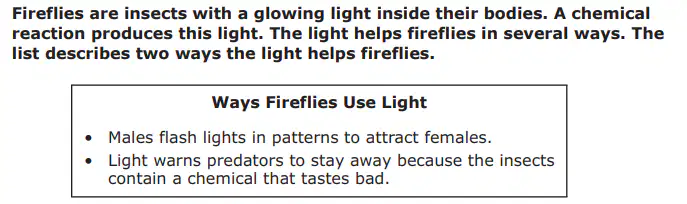
A student claims that a firefly population experienced a change that made it impossible for the insects to flash their lights. Which of these changes would support the student’s claim?
The population would increase, because predators could no longer see the fireflies to catch them as prey.
The population would decrease, because the male fireflies could not attract mates without their lights.
The population would increase, because more fireflies would move into the unlit area, thinking it was empty.
The population would decrease, because prey for the fireflies would no longer be able to see their lights.
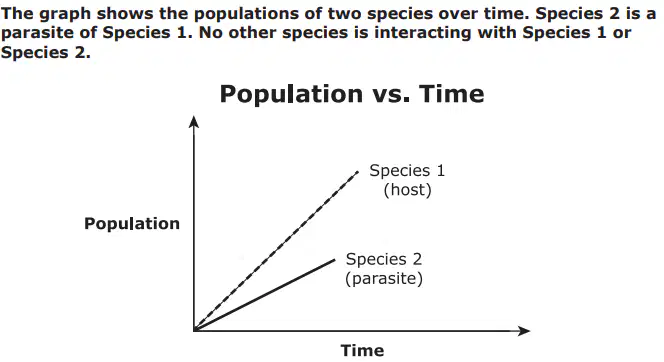
If the population of Species 1 decreased, what would most likely happen first to Species 2?
Species 2 would increase in number.
Species 2 would decrease in number.
Species 2 would become extinct.
Species 2 would find a different host.
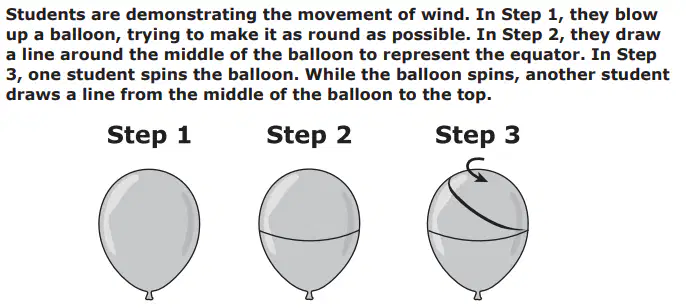
In which two ways can this model represent the Coriolis effect?
Warm air rising causes cooler air to sink to the surface.
Rotation of Earth causes the wind to appear to curve.
Wind at the equator is denser than wind at the poles.
Cool air flows faster than warmer air as it moves across Earth.
The amount the wind appears to curve depends on the speed of Earth’s rotation.
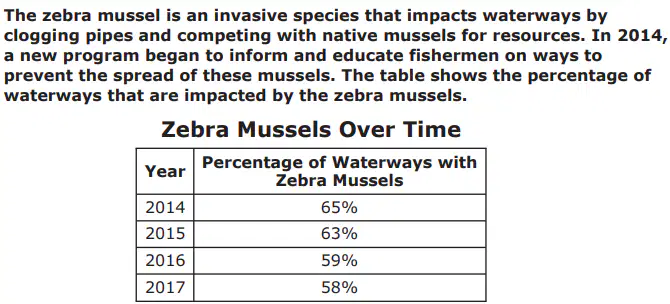
What has been the overall impact of the new program on the spread of zebra mussels?
a decrease in the number of zebra mussels along the waterways
an increase in the number of zebra mussels along the waterways
no effect because more time is needed to determine an outcome
no change in the number of zebra mussels infecting the waterways
Which of these best explains how frontal boundaries can lead to severe storms?
Cold air flows down the side of a mountain away from the ocean.
Cold air remains over an ocean for an extended period of time.
Warm air is forced up rapidly by a cold air mass.
Warm air rises slowly over a cold air mass.
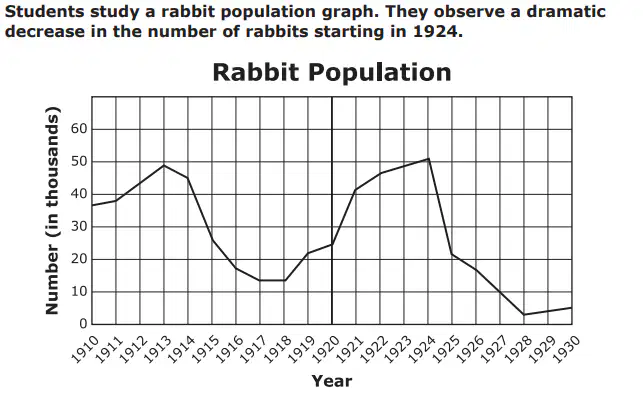
Students study a rabbit population graph. They observe a dramatic decrease in the number of rabbits starting in 1924. Select the three factors that may have caused this decrease in the rabbit population.
an increase in the predator population
an increase in the producer population
a disease in the rabbit population
a slight decrease in the rainfall
a decrease in the producer population
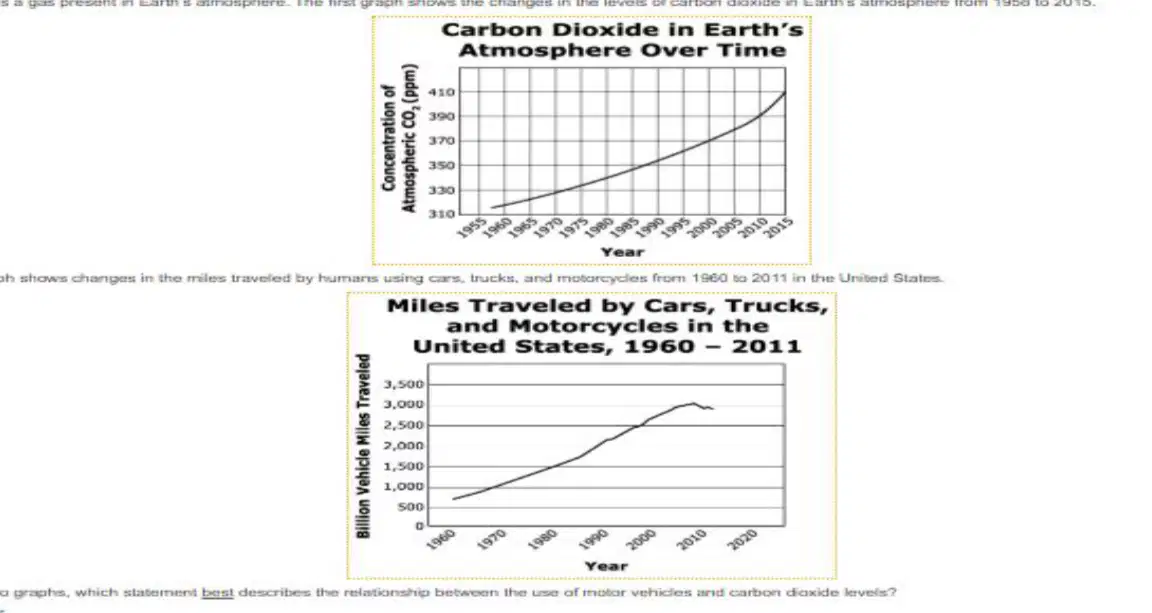
Based on the two graphs, which statement best describes the relationship between the use of motor vehicles and carbon dioxide levels?
The increased use of motor vehicles in the United States during these years caused a decrease in carbon dioxide in Earth's atmosphere.
The decreased use of motor vehicles in the United States during these years caused an increase in carbon dioxide in Earth's atmosphere.
The decreased use of motor vehicles in the United States during these years caused a decrease in carbon dioxide in Earth's atmosphere.
The increased use of motor vehicles in the United States during these years caused an increase in carbon dioxide in Earth's atmosphere.
Which statement correctly describes one way ocean currents affect a region?
Deep ocean currents push into estuaries, creating sand deposits that form barrier islands.
Cold ocean currents along the equator increase evaporation rates, creating circular winds that produce tropical storms.
Warm ocean currents keep coastal air temperatures warm, creating moderate climate conditions in coastal regions.
Deep ocean currents move water from polar seas toward the equator, creating drafts of cold air that blow over polar regions.
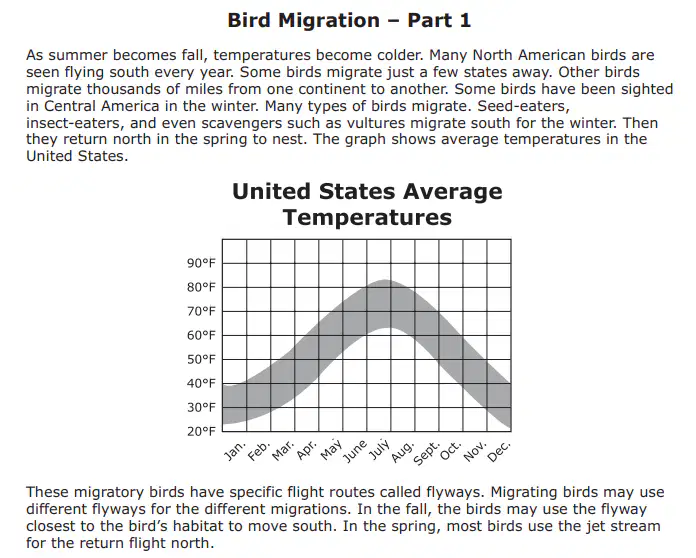
Based on the information given, which biotic factor that changes annually most likely signals the birds to migrate?
loss of offspring
reduction of food sources
increase in the number of predators
number of female birds in the population
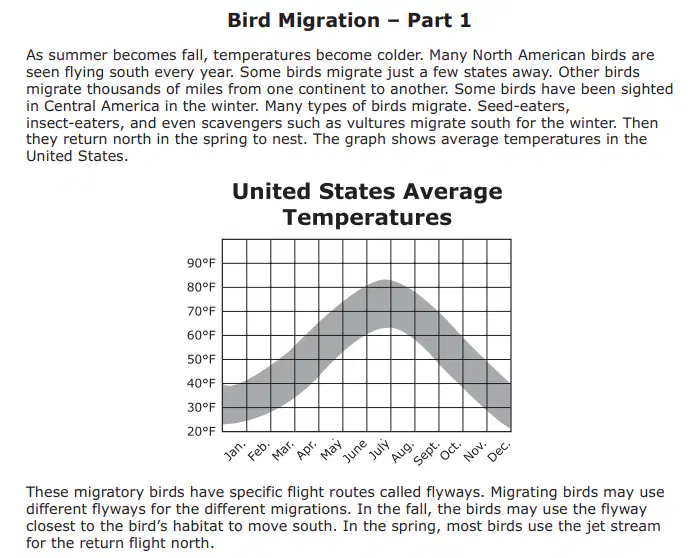
Refer to the passage and diagrams. Birds migrate south for the winter because ____.
they want to avoid harsh winter conditions
they are searching for food
they are looking for a breeding ground
they follow ancient migration routes
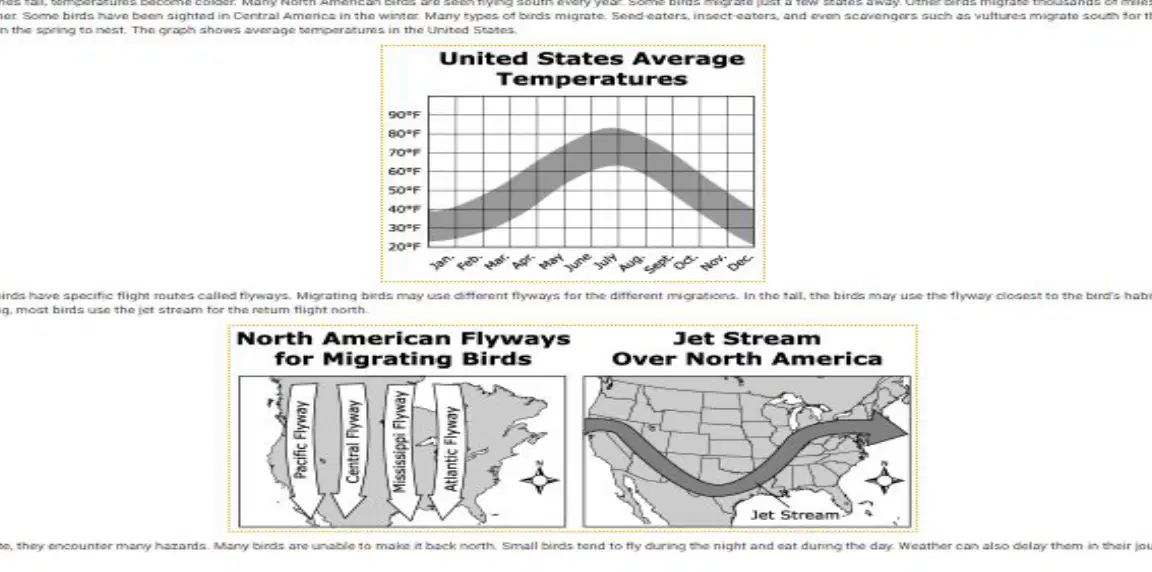
Based on the data in the graph, which statement best explains the relationship between the data provided and fall bird migration?
A. When average monthly temperatures begin to decrease, it means migration should begin.
B. When average monthly temperatures are constant, it means migration should begin.
C. When the temperatures are highest for the year, it means migration should begin.
D. When the temperatures are above or below the shaded region indicating average temperature, it means migration should begin.
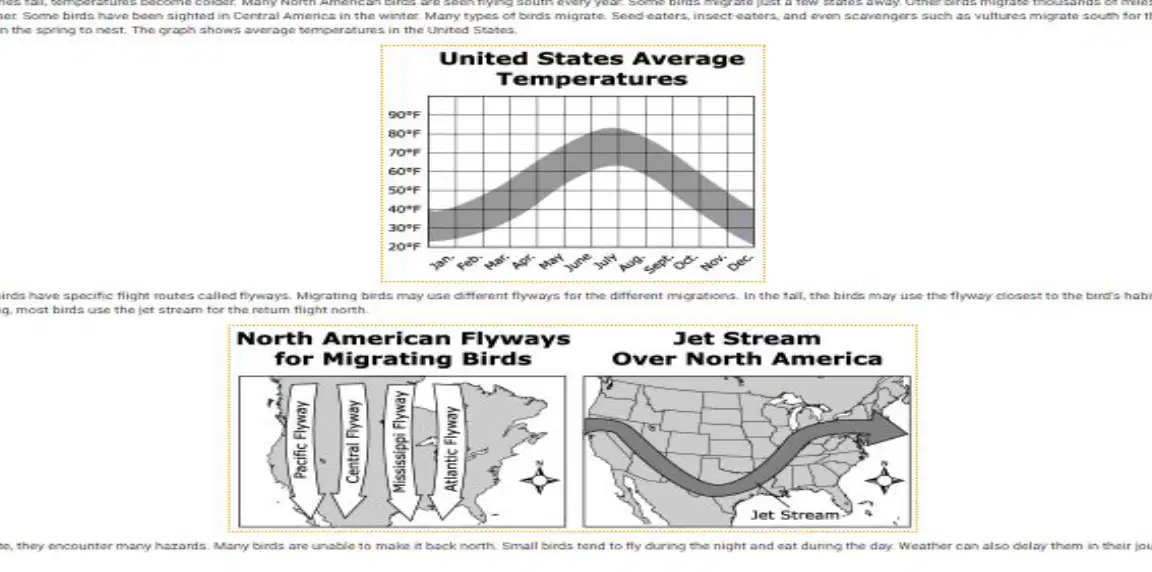
Based on the jet stream map, how does the weather north of the jet stream affect the fall bird migration?
The weather is warm and will delay migration.
The weather is stormy and will prevent migration.
The weather is colder and will trigger early migration.
The weather is warmer and sunny and will delay migration.
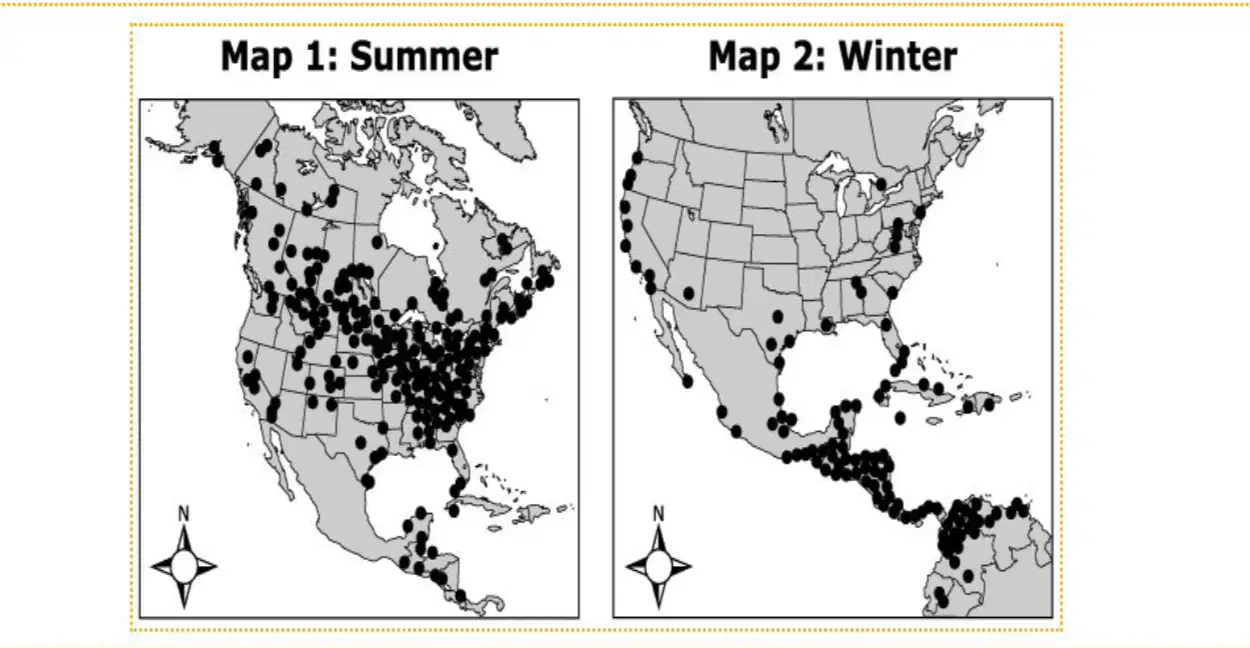
According to the passage, in which regions has the Tennessee warbler been spotted during the fall?
Western United States and Canada
Southeastern United States and Central America

What is the average temperature in Taiga Forests in North America in January?
-18°C
-15°C
-35°C
-5°C
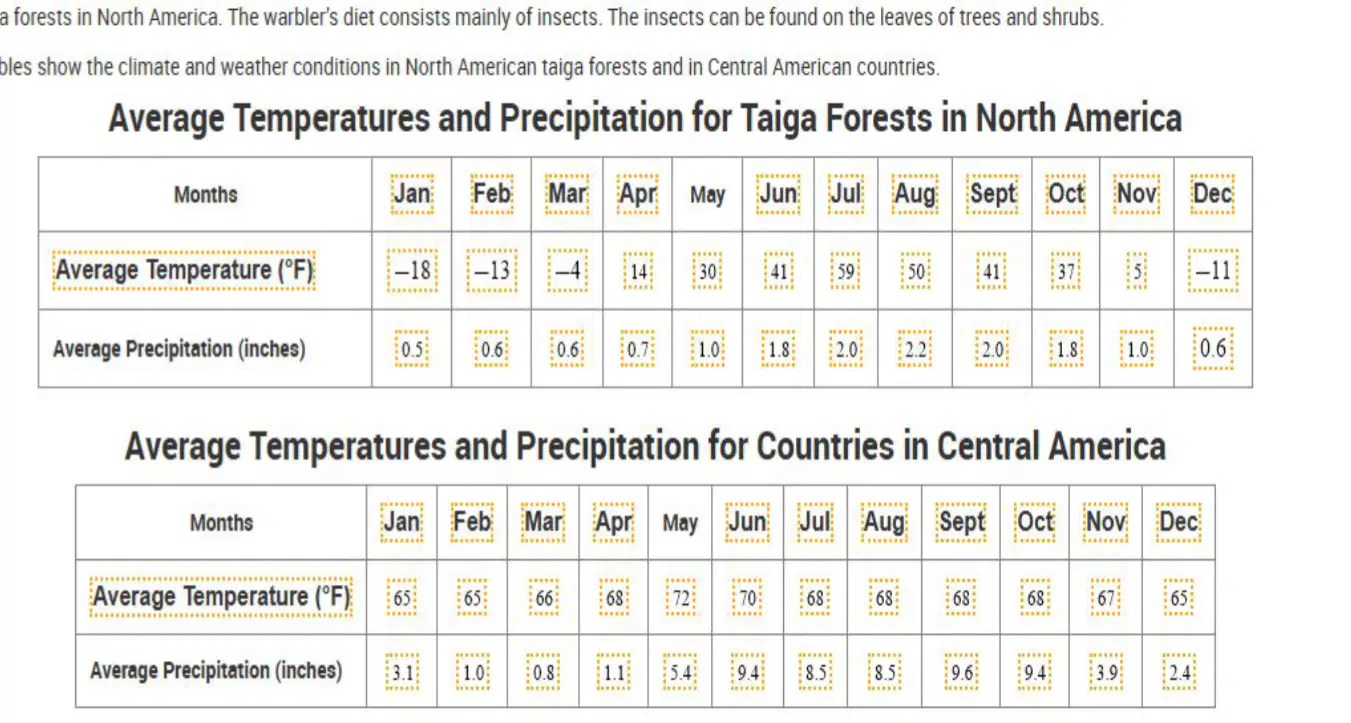
In which month does Central America have the highest average precipitation according to the table?
September

Compare the average temperatures in July for Taiga Forests in North America and Central America. Which one is higher?
Taiga Forests in North America
Taiga Forests in Central America
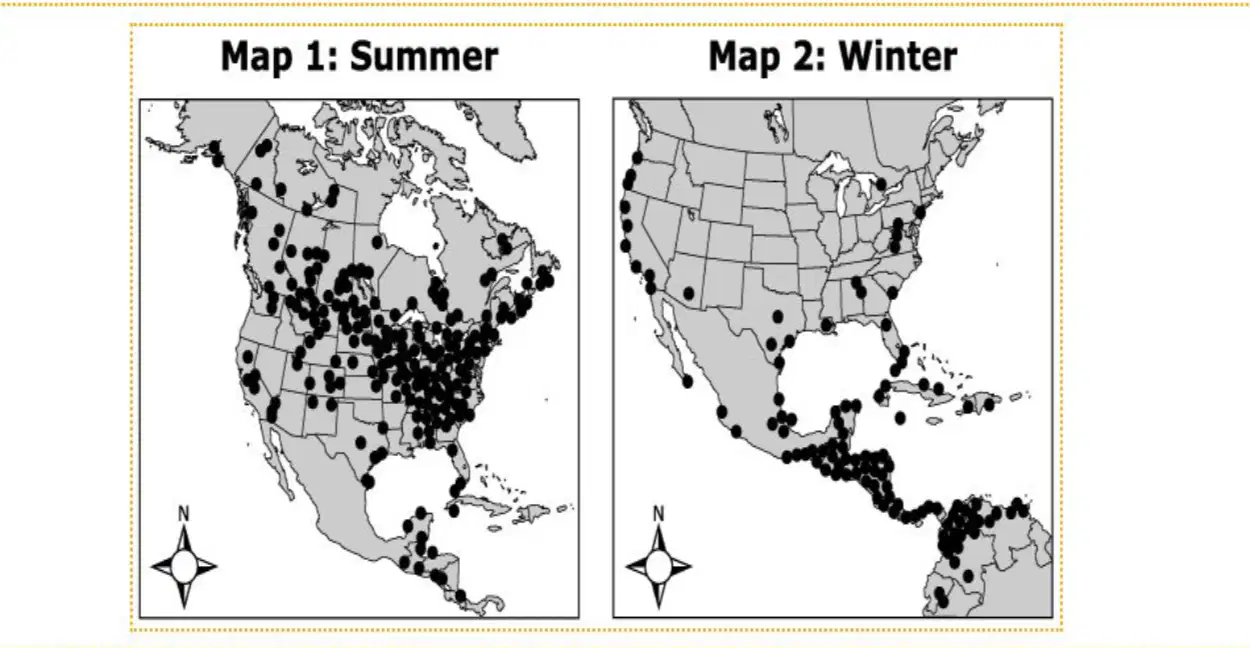
Based on the maps provided, Tennessee warblers are most commonly found in _______ during the winter?
Central America
South America
North America
Europe
The migratory journey of birds like the Tennessee warbler may be delayed by factors such as ______.
Adverse weather conditions
Abundant food supply
Increased daylight hours
Optimal migration timing
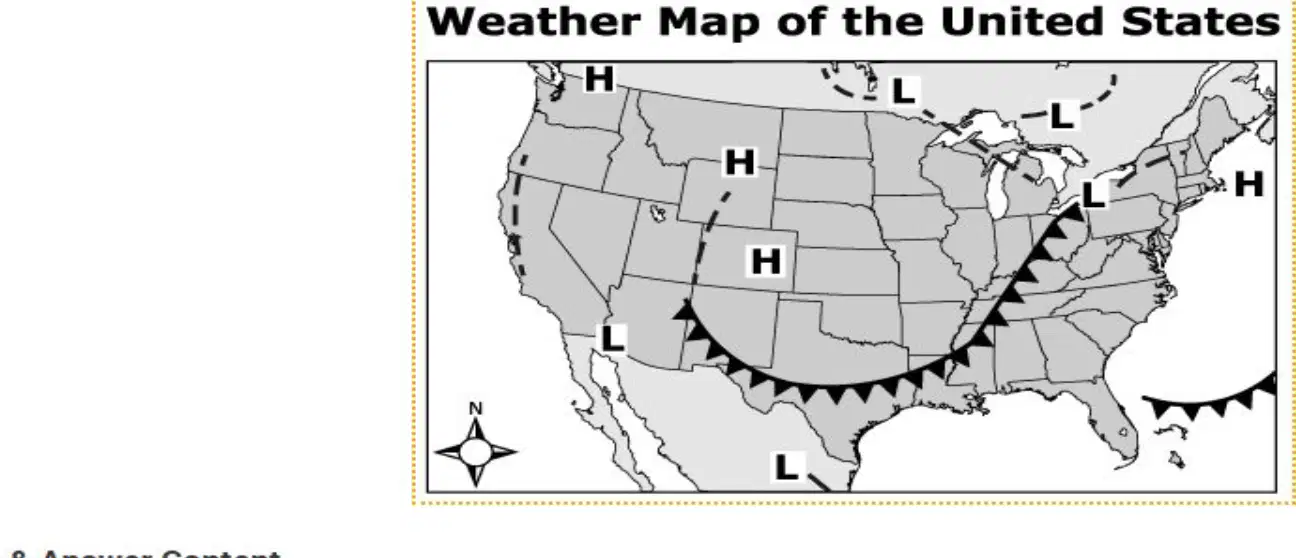
Which factor is the primary trigger for the Tennessee warbler migrating south to Central America?
abundant food sources
cold temperatures
increased habitat
moderate precipitation

Based on the data on the taiga forests, which change could possibly affect the warblers if a spring season brought daily temperatures higher than 70°F?
The warblers will move toward the coast because the temperatures will be stable near the water.
The warblers will move farther north because they require a cooler range of temperatures to survive.
The warblers will remain in the same place because they will adapt to the changing temperatures.
The warblers will decrease in number because there are few birds that can adapt to the higher temperatures.
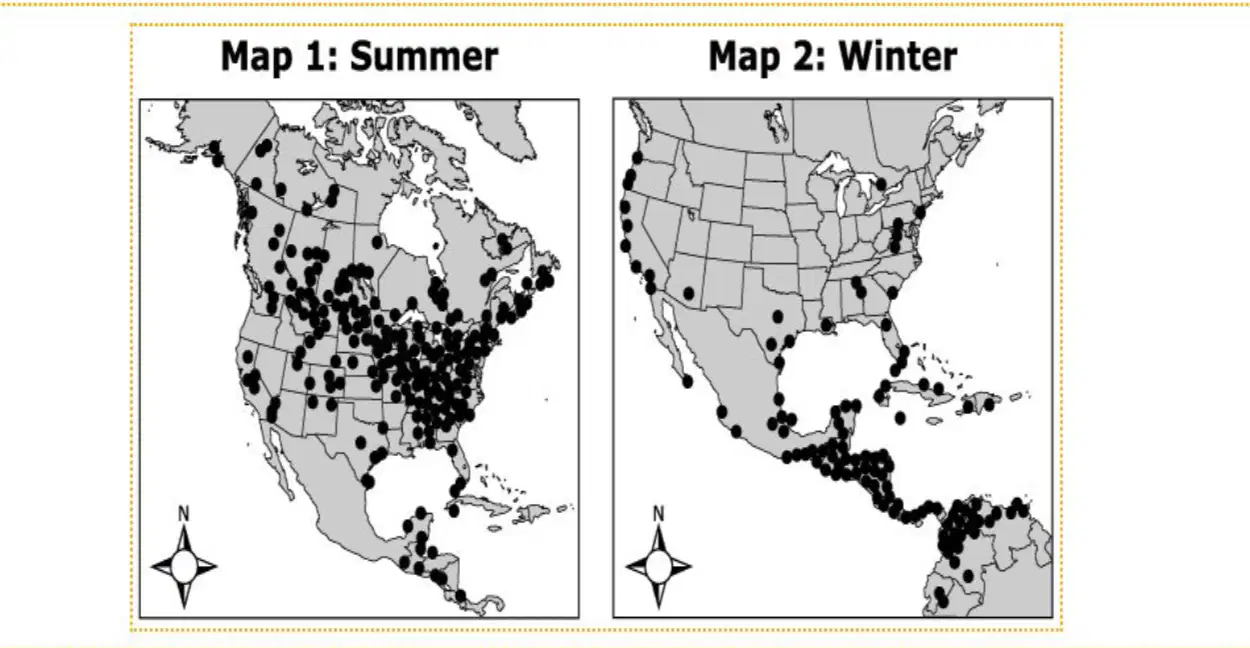
Based on Map 1 and Map 2, which statement correctly describes the average weather for the locations while the Tennessee warblers are there?
The temperatures are very high with large amounts of rain.
The temperatures are very cold with thunderstorms.
The temperatures are between 50°F and 65°F with little precipitation.
The temperatures are decreasing from 80°F to 90°F with increasing precipitation.
In some parts of Hawaii, nonnative grasses have been planted for cattle feed, replacing some of the native rain forest plants. Which statement describes the most likely impact of the replacement of rain forest plants with nonnative grasses?
The biodiversity of these areas will decrease.
Rain forest plants will outcompete nonnative grasses for resources.
Less nitrogen will be absorbed from the atmosphere over these areas.
Cattle will get fewer nutrients grazing on nonnative grasses than on rain forest plants.
Energy from the wind is used to turn windmills. These windmills then spin a generator and produce electricity. Which statement would not support the claim that wind energy is considered a clean, renewable resource?
A. Wind energy is produced naturally
B. Wind energy is used without giving off greenhouse gases.
C. There is an abundant supply of wind energy available for use.
D. There are only certain places that are suitable for collecting wind energy.
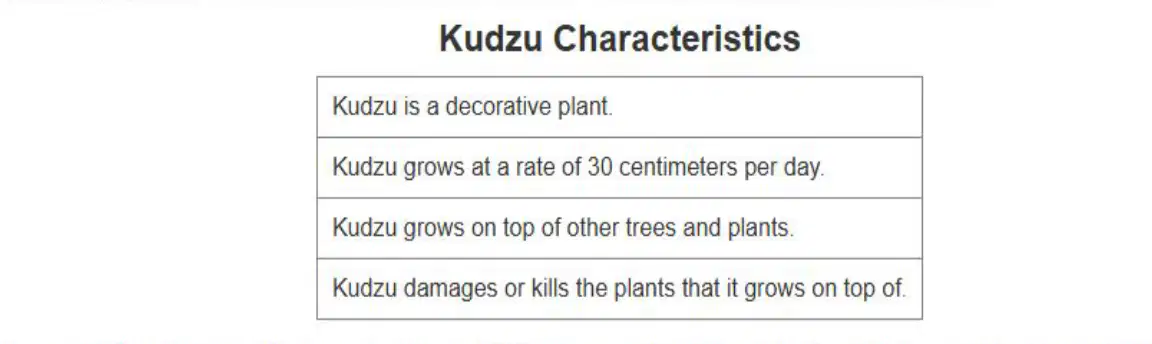
People are trying to find ways to control the growth of kudzu. Which three methods would best reduce the spread of kudzu in Tennessee?
A. Water the trees that kudzu grows on top of more often.
B. Use chemicals that slow down the growth of kudzu.
C. Add insects that feed only on kudzu to the ecosystem.
D. Dig up the roots of kudzu plants.
E. Use fertilizers on kudzu plants.

Which graph correctly shows how the number of gray wolf sightings would change if more rabbits were available beginning in 1993?
A) The number of sightings would increase.
B) The number of sightings would decrease.
C) The number of sightings would remain the same.
D) The number of sightings would fluctuate randomly.

Which graph correctly represents the trend in Gray Wolf Sightings from 1990 to 2011?

A

B

C

D
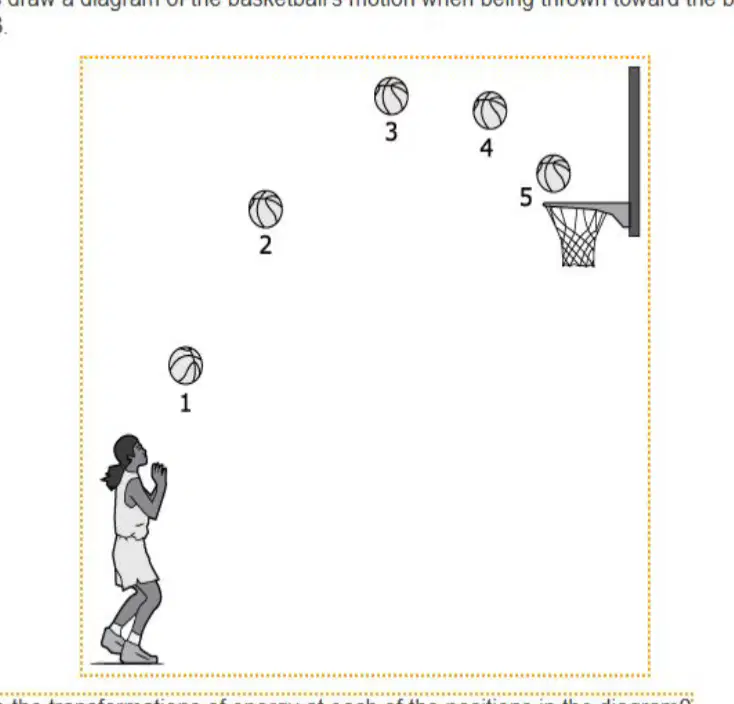
After playing basketball, two students draw a diagram of the basketball’s motion when being thrown toward the basket. In the diagram shown, the ball is at its highest point at position 3. Which of these correctly describe the transformations of energy at each of the positions in the diagram?
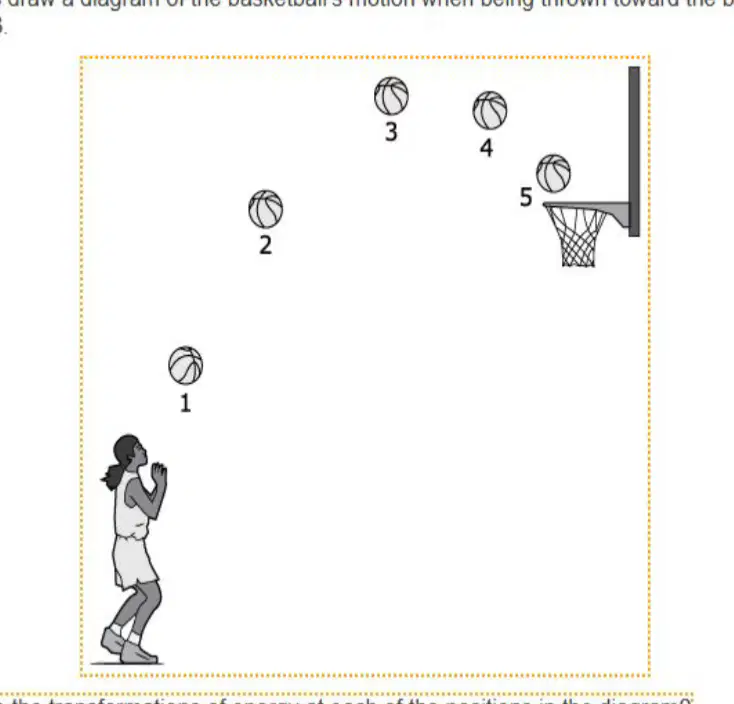
Which two of these correctly describe the transformations of energy at each of the positions in the diagram?
Position 1: Kinetic energy is decreasing and potential energy is increasing.
Position 2: Kinetic energy is increasing and potential energy is decreasing.
Position 3: Kinetic energy is increasing and potential energy is increasing.
Position 4: Kinetic energy is decreasing and potential energy is increasing.
Position 5: Kinetic energy is increasing and potential energy is decreasing.
A region includes a coastal wetland area. The wetland is a habitat for many types of wildlife. Members of the community surrounding the wetland design a plan that has two goals. The first goal is to provide recreation opportunities for humans in the wetland. The second goal is to protect the biodiversity of wildlife living there. Which plan will best meet both goals?
Drain water from the wetland to make dry hiking trails and relocate fish to a nearby lake.
Pave part of the wetland for a parking lot and build a visitor center with cabins for overnight guests.
Construct observation decks over the wetland and build docks for catch-and-release fishing.
Drain part of the wetland to construct a sports field and use the remaining water area as a harbor for boats.
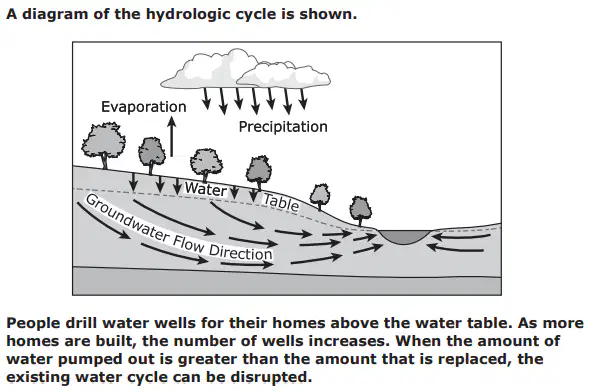
Which two effects will drilling many wells have on the existing hydrologic cycle?
Drilling many wells will lower the water table.
Drilling many wells will speed up the water cycle.
Drilling many wells will cause water to evaporate faster.
Drilling many wells will prevent water from entering the ground.
Drilling many wells will cause less water to flow into lakes and streams.
Scientists are investigating how solar energy can be used along with other energy sources. Which of these best describes why scientists are exploring the use of other types of renewable energy sources along with solar energy?
The collection of solar energy is limited to daylight hours.
Solar energy can be transformed only into electrical energy.
The collection of solar energy requires constant monitoring.
Solar energy is less popular than other types of energy.
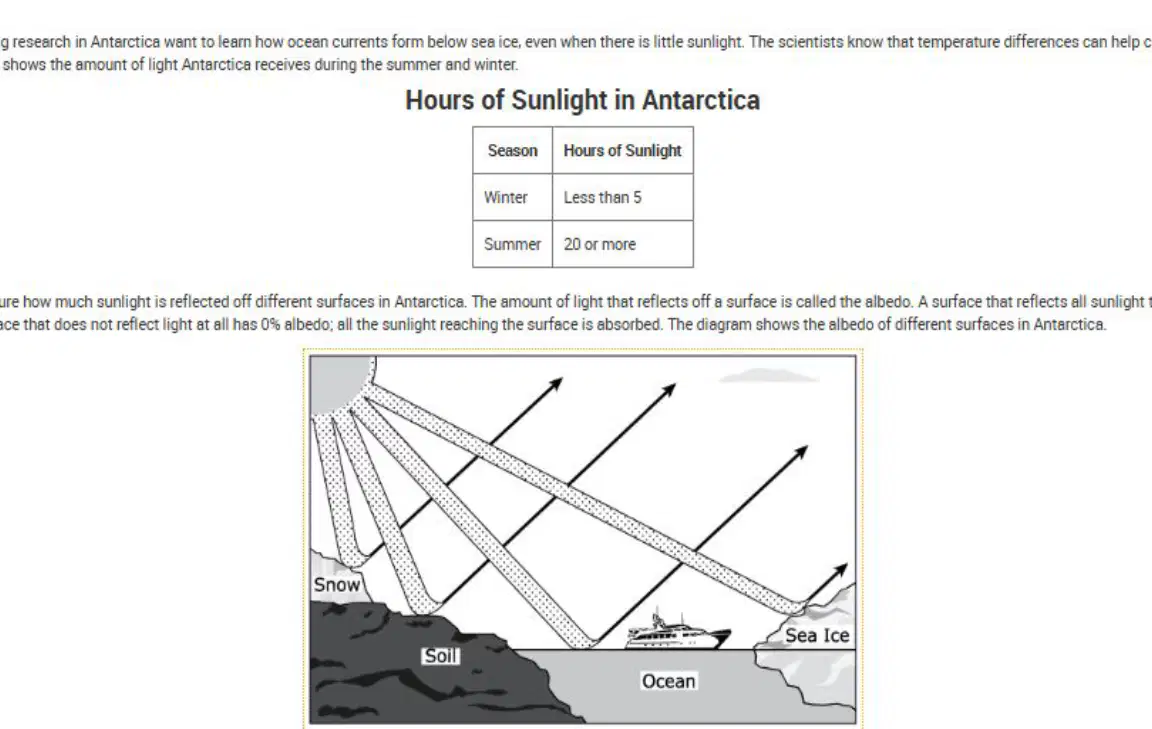
What is the albedo of a surface that reflects all sunlight?
0%
50%
100%
75%
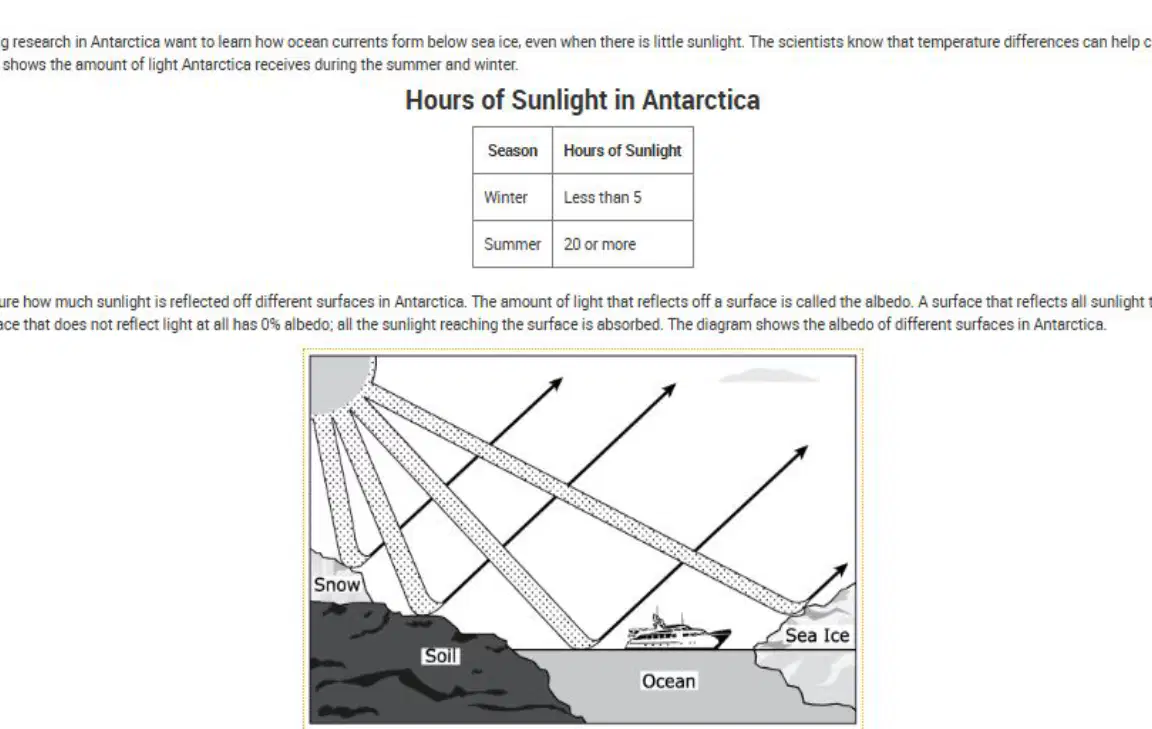
During which season does Antarctica receive 20 or more hours of sunlight?
Winter
Spring
Summer
Fall

Which source of thermal energy is responsible for melting the sea ice?
The ocean heats the sea ice through chemical energy transfer.
The wind heats the sea ice through mechanical energy transfer.
The sun heats the sea ice through radiation energy transfer.
The sea salt heats the ice through electrical energy transfer.
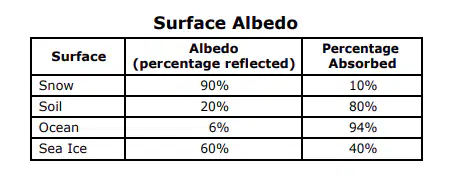
Which statement correctly compares the albedo of different surfaces?
A. Snow absorbs more thermal energy than ocean water because it has a higher albedo than ocean water.
B. Soil absorbs more thermal energy than sea ice because it has a higher albedo than sea ice.
C. Ocean water absorbs less thermal energy than soil because it has a lower albedo than soil.
D. Sea ice absorbs less thermal energy than ocean water because it has a higher albedo than ocean water.
How will a decrease in average summer sea ice affect the mixing of surface water and deep ocean currents?
More sunlight will be absorbed, which will heat the surface water and increase the chance that surface water will mix with deep water.
Less sunlight will be absorbed, which will cool the surface water and increase the chance that surface water will mix with deep water.
More sunlight will be absorbed, which will heat the surface water and reduce the chance that surface water will mix with deep water.
Less sunlight will be absorbed, which will cool the surface water and reduce the chance that surface water will mix with deep water.

