wayground logo

Free Printable Worksheets

Font size

S
M
L
XL
Worksheets

Domain, Range, Function and Scatterplot #2

Total questions: 23

Worksheet time: 50mins

Name
Class
Date
1.
For the function {(0,1), (1,-3), (2,-4), (-4,1)}, write the domain and range.
a)
D: {1, -3, -4,}
R: {0, 1, 2, -4}
b)
D: {-4, 0, 1, 2}
R:{-4, -3, 1}
c)
D: {0, 1, 2, 3, 4}
R:{1, -3, -4}
d)
D: {0, 1, 2, -4}
R: {1, -3, -4, 1}
2.

Which is the set of all y-values or the outputs?

a)

Domain

b)

Range

c)

Relation

d)

Function

3.
What is the domain?
a)
{-2, -1, 0, 1, 8}
b)
{3, 5, 7 , 9, 0}
c)
{-2, -1, 0, 1, 3, 5, 7, 8, 9}
d)
{-2, -1, 0, 1, 2, 3, 4, 5, 6, 7, 8, 9}
4.

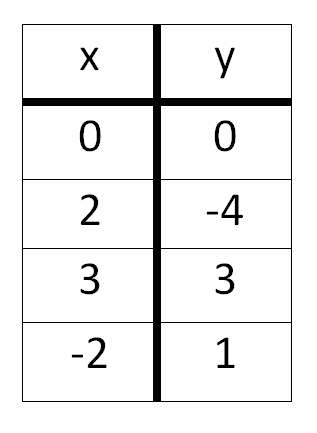
What is the range of the table?

a)

{-4, 0, 1, 3}

b)

{-2, 0, 2, 3}

c)

{-4, -2, 0, 1, 2, 3}

d)

{ (0, 0), (2, -4), (3, 3), (-2, 1) }

5.
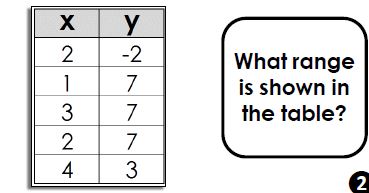
What is the range?
a)
{-2,2,5}
b)
{1,3,5,6}
c)
all real numbers 
d)
-2<y<5
6.
What is the domain?
a)
all real numbers
b)
1<x<6
c)
{1,3,4,6}
d)
{-2,2,5}
7.

What is the input?

a)

0, 4, 10, 12

b)

1, 2, 4, 5, 10, 12

c)

0, 4, 10, 4, 12

d)

1, 2, 5

8.

Give the range of the set of ordered pairs: (2, 11), (9, -3), (7, 21), (-8, 6)

a)

{2, 9, 7, -8}

b)

{11, -3, 21, 6}

c)

-8 < x < 9

d)

-3 < y < 21

9.
a)

{-2, 3, 7}

b)

[-2, 7]

c)

{1, 2, 3, 4}

d)

[1, 4]

10.

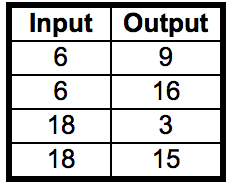
What is the domain of the relation shown in the table?

a)

{12}

b)

{6, 18}

c)

{3, 9, 15, 16}

d)

{13}

11.
What is the definition of function?
a)
Has inputs and outputs
b)
Every input has only ONE output
c)
Inputs have different outputs every time
d)
x-values and y-values
12.
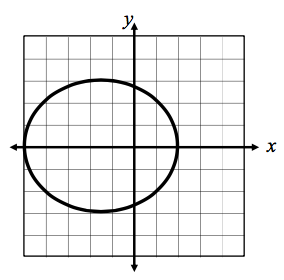
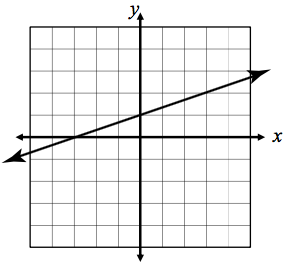
Is this graph a function or not a function? 
a)
Function 
b)
Not a Function 
13.
Is this graph a function or not a function? 
a)
Function
b)
Not a Function
14.
Is this graph a function or not a function? 
a)
Function
b)
Not a Function 
15.

Is this table a function or not a function?

a)

Function

b)

Not a Function

16.

Is this table a function or not a function?

a)

Function

b)

Not a Function

17.

Is this table a function or not a function?

a)

yes, it is a function

b)

no, it is not a function

18.

Which set of values is a function?

a)

(9,5) (10,5) (9,-5) (10,-5)

b)

(3,4) (4,-3) (7,4) (3, 8)

c)

(6,-5) (7, -3) (8, -1) (9, 1)

d)

(2, -2) (5, 9) (5, -7) (1, 4)

19.
Which conclusion is best supported by the scatterplot?
a)
As the length of a call increases, the cost of the call increases.
b)
As the length of a call increases, the cost of the call remains the same.
c)
As the length of a call increases, the cost of the call decreases.
d)
There is no relationship between the length of a call and the cost of the call.
20.
Which scatter plot shows a negative relationship?
a)
Graph A
b)
Graph B
c)
Graph C
d)
Graph D
21.
Which scatter plot shows no relationship?
a)
Graph A
b)
Graph B
c)
Graph C
d)
Graph D
22.
Which scatter plot show a positive relationship?
a)
Graph A
b)
Graph B
c)
Graph C
d)
Graph D
23.

Describe the association for the scatterplot based on data plotted.

a)

As the weeks increase, the amount of money on the gift card increases.

b)

As the weeks decrease, the amount of money on the gift card increases.

c)

There is no relationship between the time in weeks and the amount of dollars.

d)

As the weeks increase, the amount of money on the gift card decreases.