
 Worksheets
Weather Forecast and Station Plots
Total questions: 35
Worksheet time: 26mins
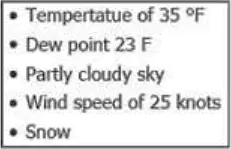
Which station plot correctly depicts this data?

A. [Image of station plot]

B. [Image of station plot]

C. [Image of station plot]

D. [Image of station plot]
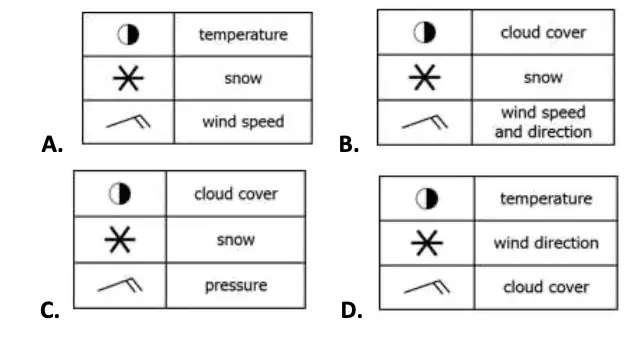
Which table correctly identifies three weather symbols found on a station model?
A
B
C
D
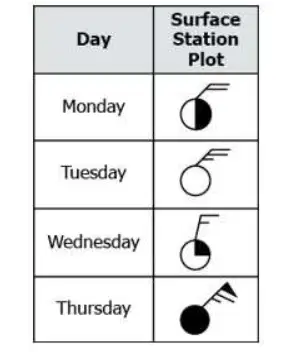
A student researched the surface station plot for his city for four days. On which day was the wind speed the lowest?
Monday
Tuesday
Wednesday
Thursday

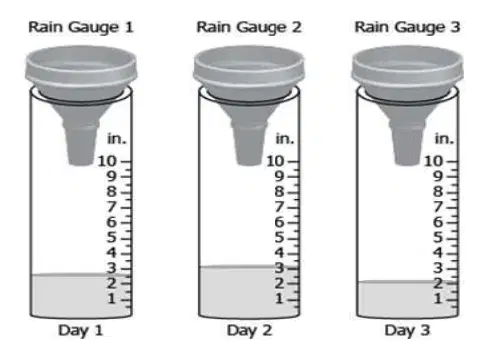
A student recorded the amounts of precipitation for three days using three different rain gauges as shown in the image. Which statement correctly compares the data?
Day 1 was drier than Day 2 but wetter than Day 3.
Day 2 was drier than Day 3 but wetter than Day 1.
Day 3 was wetter than Day 2 but drier than Day 1.
Day 1 was wetter than Day 2 but drier than Day 3.
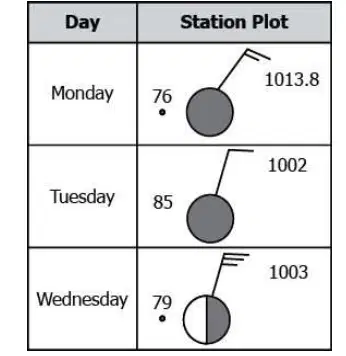
Based on the data, which day(s) had both 100% cloud cover and rain?
A. Monday only
B. Wednesday only
C. Monday and Tuesday
D. Tuesday and Wednesday
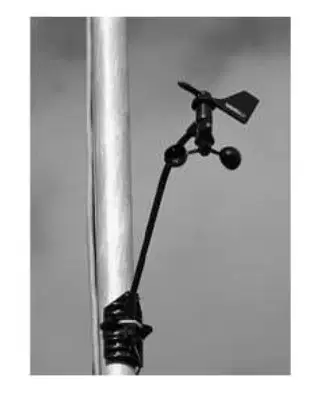
What information will a meteorologist be able to receive from the tools shown?
the direction of the wind and the current air pressure in millibars
the direction of the wind and speed of the wind in miles per hour
the speed of the wind in millibars and the direction of the wind
the current air pressure and the speed of the wind in miles per hour
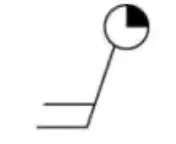
The image shows a weather station symbol. What statement best describes the weather conditions?
75 percent cloud cover with a wind speed of 20 knots
25 percent cloud cover with a wind speed of 10 knots
75 percent cloud cover with a wind speed of 10 knots
25 percent cloud cover with a wind speed of 20 knots
Which of these is the main contributor to the formation of hurricanes?
high barometric pressure
warm ocean air
calm ocean surface
dense surface air


Which two cities are most likely to experience clear, dry weather?
Seattle & San Francisco
Chicago & Minneapolis
Chicago & Nashville
Dallas & Houston
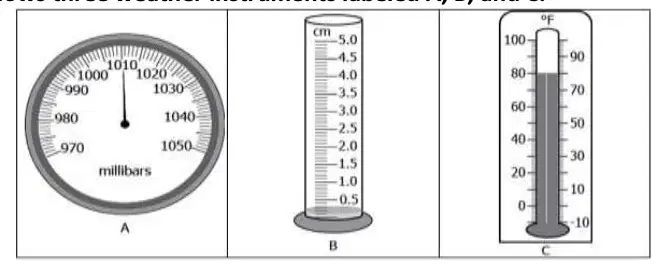
The diagram shows three weather instruments labeled A, B, and C. Which table correctly identifies the weather instruments and the weather data the instruments measure?
Tool: A - rain gauge, rainfall; B - barometer, air pressure; C - thermometer, temperature.
Tool: A - barometer, temperature; B - thermometer, pressure; C - rain gauge, rainfall.
Tool: A - barometer, air pressure; B - rain gauge rainfall; C - thermometer, temperature.
Tool: A - thermometer, temperature; B - barometer, pressure; C - rain gauge, rainfall.

The weather station symbols show the weather conditions predicted for a location over the next four days. On which day would an umbrella most likely be needed?
Day 1
Day 2
Day 3
Day 4
Which of these is associated with hurricanes?
a storm that forces strong winds toward the ground
a storm that develops in warm air closer to the equator
a storm that develops many high-pressure thunderstorm clouds
a storm that causes an area of low pressure beneath the warm air
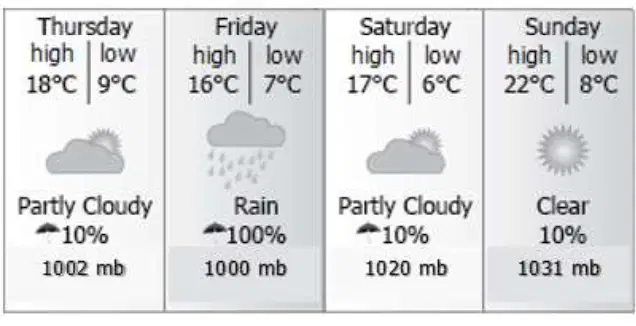
Based on the data, which forecast is likely for Monday?
mostly cloudy
cloudy with showers
clear and sunny
thunderstorms
What is the difference in an anemometer and a wind vane?
An anemometer measures wind direction, and a wind vane measures wind speed.
An anemometer measures air pressure, and a wind vane measures wind direction.
An anemometer measures wind speed, and a wind vane measures air pressure.
An anemometer measures wind speed, and a wind vane measures wind direction.

Which image represents the air mass movement associated with a stationary front?
A
B
C
D

Which weather conditions likely will exist in the two regions?
Regions 1 and 2 will have fair weather conditions.
Regions 1 and 2 will have stormy weather conditions.
Region 1 will have fair weather, and Region 2 will have stormy weather.
Region 1 will have stormy weather, and Region 2 will have fair weather.
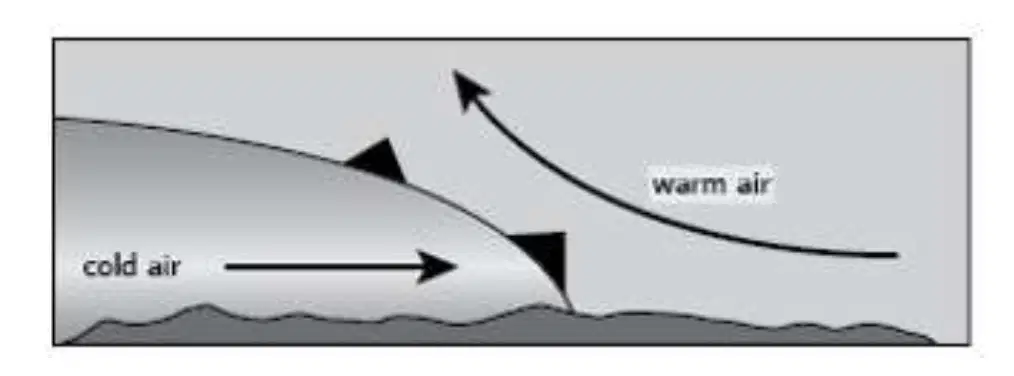
Which weather condition will most likely result from this movement?
warmer temperatures and precipitation
warmer temperatures and clear skies
cooler temperatures and precipitation
cooler temperatures and clear skies
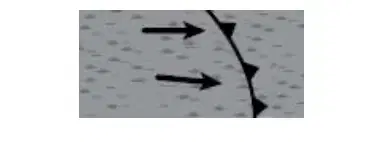
Which type of weather front is shown, and how does it form?
A. A cold front; a cold air mass slides under a warm air mass, creating a cold front.
B. A warm front; a warm air mass rides above a cold air mass, creating a warm front.
C. A stationary front; a warm and cold air mass collide and do not move.
D. An occluded front; two cold air masses surround a warm air mass.
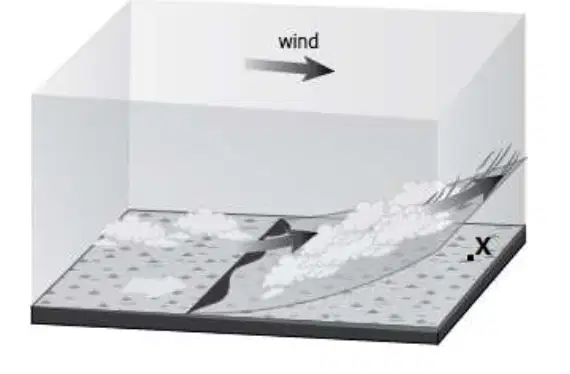
A student makes a model to show a weather front and a city labeled X. Which table identifies the type of front and the likely forecast for city X?
Type of Front: warm, Weather Forecast: City X will experience a long period of precipitation and warmer temperatures.
Type of Front: cold, Weather Forecast: City X will experience strong thunderstorms and cooler temperatures.
Type of Front: warm, Weather Forecast: City X will experience strong thunderstorms and cooler temperatures.
Type of Front: cold, Weather Forecast: City X will experience a long period of precipitation and cooler temperatures.
Which of the following describes an air mass with the symbol cT?
Cold and dry
Warm and dry
Cold and moist
Warm and moist
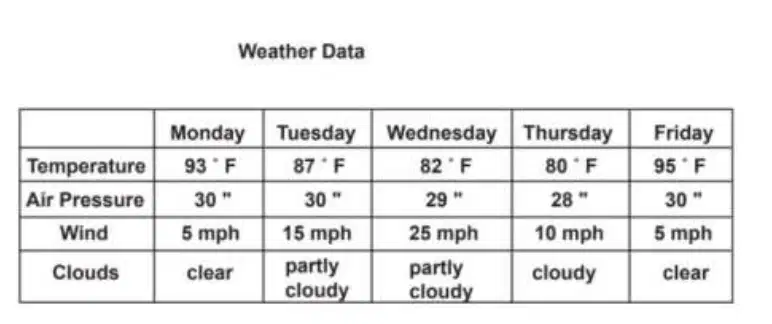
Using the weather data, on which day will it most likely rain?
Monday
Tuesday
Wednesday
Thursday
Why does the equator experience about the same temperatures year-round?
The sun’s rays strike the equator at about the same angle
It has no mountains to affect its climate
It has no prevailing winds
It tilts toward the sun and gets much more direct solar energy.
Which of the following increases air’s ability to hold water vapor?
Decrease in wind speed
Increase in air pressure
Increase in temperature
Decrease in temperature
What causes changes in weather?
Air masses move and meet
Clouds
Evaporation
Humidity
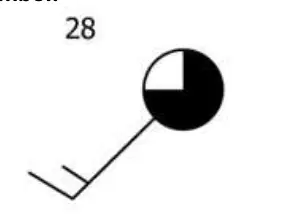
The image shows a weather station symbol. Which weather indicators does the symbol indicate?
A. air mass and air pressure
B. air pressure and precipitation
C. precipitation, air mass, and temperature
D. cloud cover, temperature, and wind speed


Near which city is the high pressure system located?
Seattle
Minneapolis
Dallas
Chicago

Why does city "B" have clear skies?
It is in North America
There is not a front moving through city "B"
Clouds do not form in the West
It is located near a high pressure system
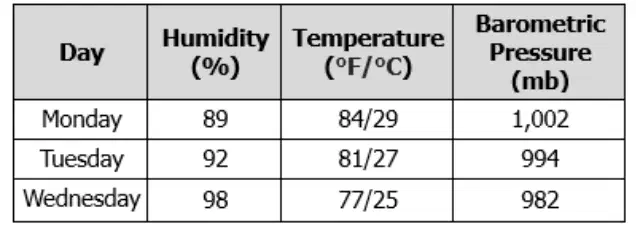
What kind of weather will the region likely experience on Thursday if the weather pattern continues?
cooler and clear
cooler and wet
hotter and dry
hotter and wet


What city will experience decreasing temperatures in the next day?
Denver
El Paso
Memphis
Los Angeles
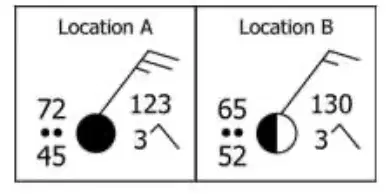
A meteorologist prepares station plots for Locations A and B as shown. What can be concluded from the data?
Location A: 0% cloud cover, wind speed of 25 knots; Location B: 50% cloud cover, wind speed of 15 knots
Location A: 100% cloud cover, wind speed of 25 knots; Location B: 50% cloud cover, wind speed of 15 knots
Location A: 100% cloud cover, wind speed of 30 knots; Location B: 50% cloud cover, wind speed of 20 knots
Location A: 0% cloud cover, wind speed of 25 knots; Location B: 50% cloud cover, wind speed of 20 knots

