
 Worksheets
Year 4 Interpreting data
Total questions: 57
Worksheet time: 2hrs 32mins

What is the total number of chocolate bars they bought ?
11
16
18
22

How many more chocolate bars did Hisham buy than Ridu ?
2
4
5
8

If each chocolate bar is worth RM 1.30, what is the total amount of money did Mun spend ?
RM 5.20
RM 6.00
RM 7.10
RM 13.00

What day do the pupils read the most number of storybooks ?
Tuesday
Wednesday
Thursday
Friday

Find the total number of storybooks read by the pupils.
165
150
170
140

Which is the most favourite sport ?
Hockey
Netball
Football
Badminton

Which the most favourite subject ?
Mathematics
Malay Language
English
Science

The total sales of ice-cream for four days is 1200. How many ice-creams were sold on Sunday ?
500
550
600
650

Shaun counts the number of boats sailing into a harbour on 5 days. How many boats does Shaun count sailing into the harbour on Monday?
30
35
40
45
Adaan counts the number of boats sailing into a harbour on 5 days. How many boats does Adaan count sailing into the harbour on Friday?
30
40
50
60

Year 4 carry out a survey to find out which is their favourite type of book. The graph shows the result of the survey. How many students like History?
4
5
6
7
Year 4 carry out a survey to find out which is their favourite type of book. The graph shows the result of the survey. What is the most popular type of book among them?
History
Natural World
Adventure
Science
Year 4 carry out a survey to find out which is their favourite type of book. The graph shows the result of the survey. How many students took part in the survey?
21
22
23
24

Mr Karuna sells ice-creams. One day he keeps a tally of his sales. How many strawberry ice-creams are sold?
15
16
17
18
Mr Karuna sells ice-creams. One day he keeps a tally of his sales. How many ice-creams did he sell altogether?
54
63
64
73

How many students take the bus to school?
35
20
10
15

How many students spent between 120 and 150 minutes doing homework?
4
3
10
16

How many employees walked to work?
22
8
10
12


How many votes did Jo get?


The incomplete pictographin Diagram 14 shows the number of mobile phones sold by 4 shops S, T,U and V.
The 4 shops together sold 600 of mobile phones. How many mobile
phones were sold by shop S.
350
250
300
200

The bar chart in Diagram 16 shows the best selling novels, P, Q, R and S, in Encik Latif's bookstore this month.
What is the difference between the number of book R sold and the number of book S sold?
300
350
400
250

Diagram 28 is a bar chart showing
the number of storybooks owned by
four boys.
What is the maximum number of storybooks owned by the four boys?
10
7
3
4

Diagram 30 is a bar chart showing the marks scored by four students in a Mathematics test.
Who scored the highest mark in the
test?
Razanah
Shamala
Nadiah
Hafizah
Bars height gives the ______________ for each category
quantity
quality
average
scale
If we change the position of any of the bars of a bar graph, Would it change the information being conveyed ?
Yes
No
I have not practiced much to answer this.
Need to work Hard
What is the total number of chocolate bars they bought ?
11
16
18
22
If each chocolate bar is worth RM 1.30, what is the total amount of money did Mun spend ?
RM 5.20
RM 6.00
RM 7.10
RM 13.00
What day do the pupils read the most number of storybooks ?
Tuesday
Wednesday
Thursday
Friday

How many total of storybooks are read by pupils on Thursday and Friday ?
20
50
70
90

Which bar chart represents the data above ?


Which is the most favourite sport ?
Hockey
Netball
Football
Badminton
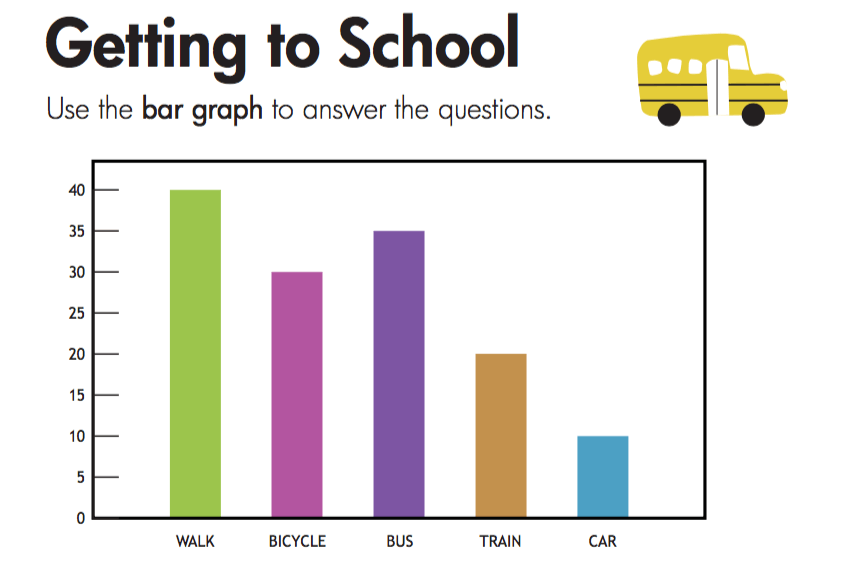
How many students ride their bicycle to school?
40
35
30
20



Based on the bar chart above, most of the people like to use ________
TV
Telephone
Radio
Computer
Ipod

The pie chart above shows the favorite fruits of a group of students. Which fruits is the most favorite fruit among students?
Grapes
Pineapple
Banana
Peach
Orange



The bar chart in Diagram 15 shows the number of students from Year 3 to Year 6 in a school.
Which level has the most number of students?
Year 3
Year 4
Year 5
Year 6

