
 Worksheets
Shear Force and Bending Moment Diagrams
Total questions: 35
Worksheet time: 23mins
Engineers need SF and BM diagrams because:
They help in understanding the internal forces and moments in a structure.
They are used to calculate the cost of materials.
They provide aesthetic value to the design.
They are required for environmental analysis.
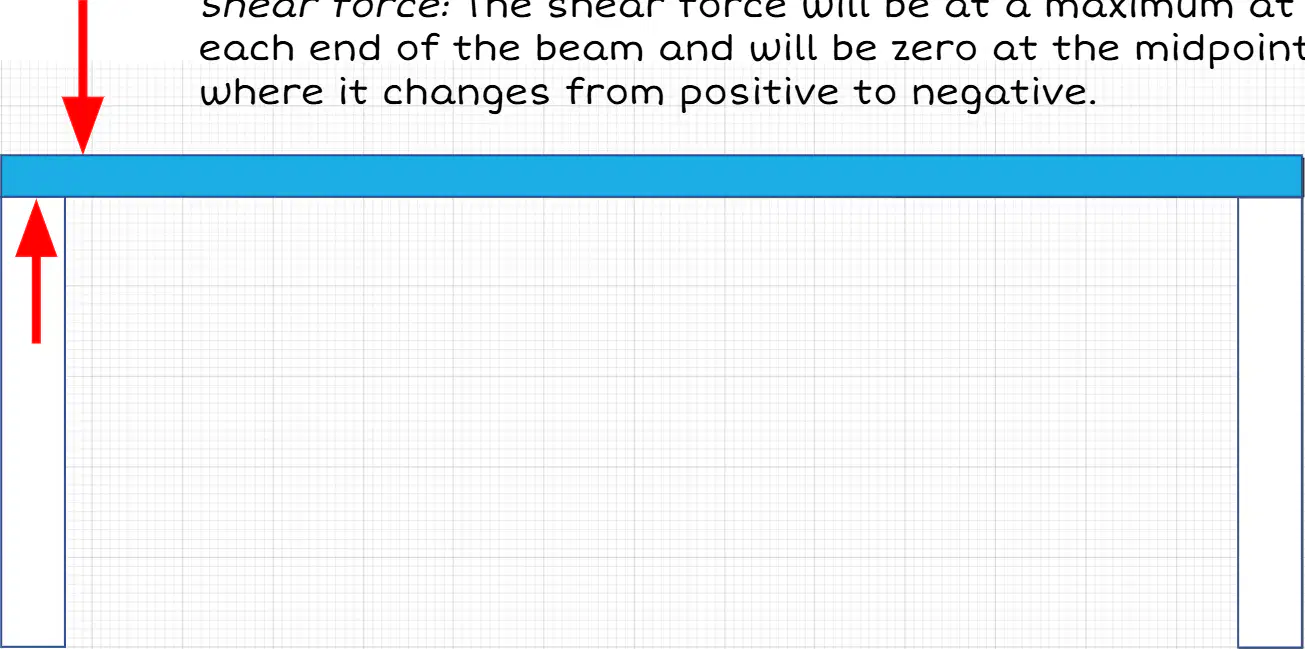
What happens to the shear force at the midpoint of the beam?
It is at a maximum
It is zero
It is at a minimum
It is negative
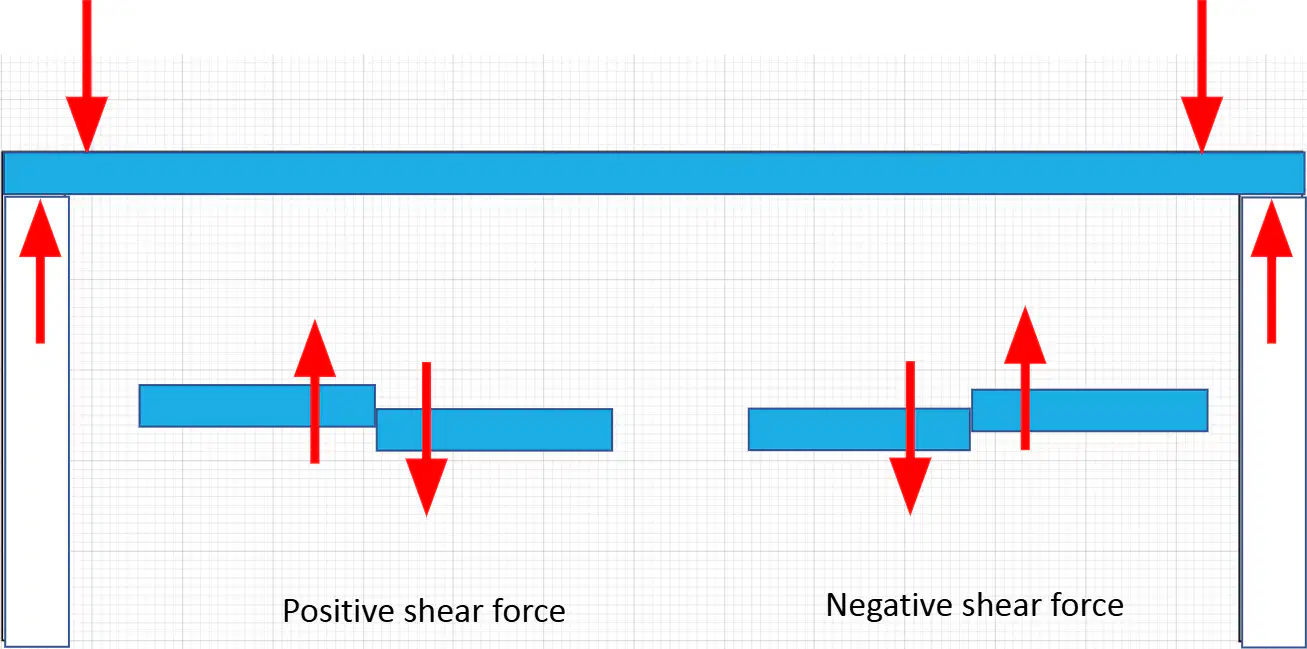
What is the difference between positive shear force and negative shear force as shown in the diagram?
Positive shear force causes clockwise rotation, while negative shear force causes counterclockwise rotation.
Positive shear force causes counterclockwise rotation, while negative shear force causes clockwise rotation.
Positive shear force and negative shear force both cause clockwise rotation.
Positive shear force and negative shear force both cause counterclockwise rotation.

In the diagram, which type of shear force is depicted on the left side?
Positive shear force
Negative shear force
A bending moment diagram is a graphical representation of the bending moment along a beam. How is it drawn?
By plotting the bending moment at various points along the beam
By measuring the deflection of the beam
By calculating the shear force at different sections
By determining the axial force in the beam

What happens to the bending moment (BM) at the ends and midpoint of a beam under load?
A) BM is maximum at the ends and zero at the midpoint.
B) BM is zero at the ends and maximum at the midpoint.
C) BM is zero at both ends and midpoint.
D) BM is maximum at both ends and midpoint.
The moment of a force is the product of force multiplied by the shortest distance between the force and the ________.
pivot point
center of mass
axis of rotation
line of action
What happens to bending when the shear force diagram crosses zero?

Fill in the blank: Maximum slide at the ends produces maximum shear and ______ bending.
bending
torsion
compression
tension

What type of bending is shown in the first diagram on the left?
A) Positive bending in a simple beam
B) Negative bending in a simple beam
C) Positive bending in a cantilever beam
D) Negative bending in a cantilever beam

The diagram on the bottom left shows ________ in a cantilever beam.
Positive bending
Negative bending
Shear force
Torsion

Why do we graph the vertical forces in SF and BM diagrams?
To visualize the distribution of forces and moments along a structure
To calculate the weight of the structure
To determine the color of the structure
To find the length of the structure
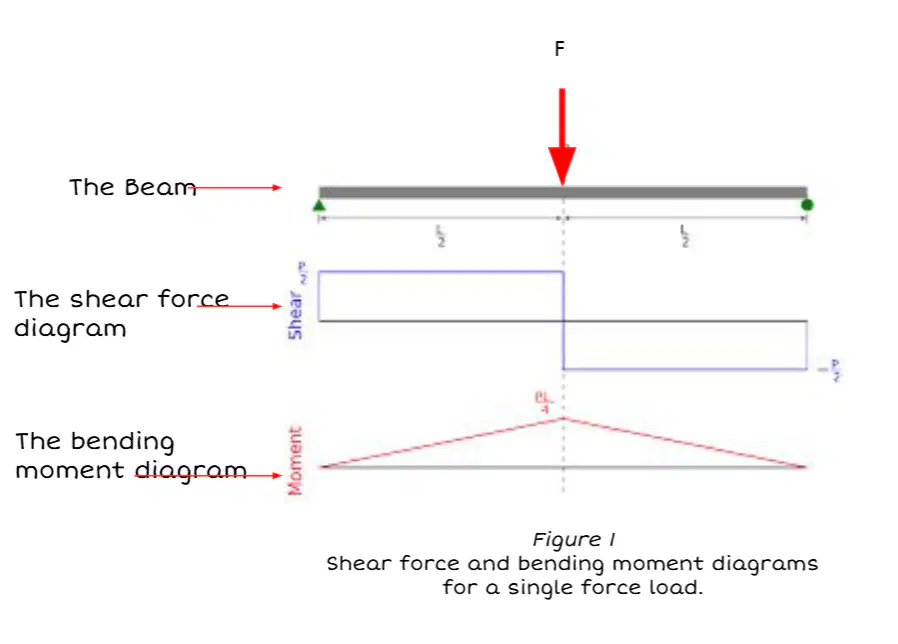
The diagram labeled 'The Beam' represents what in the context of shear force and bending moment diagrams?
A structural element subject to shear force and bending moment
A type of load applied to a structure
A method of calculating structural stability
A tool used for measuring angles
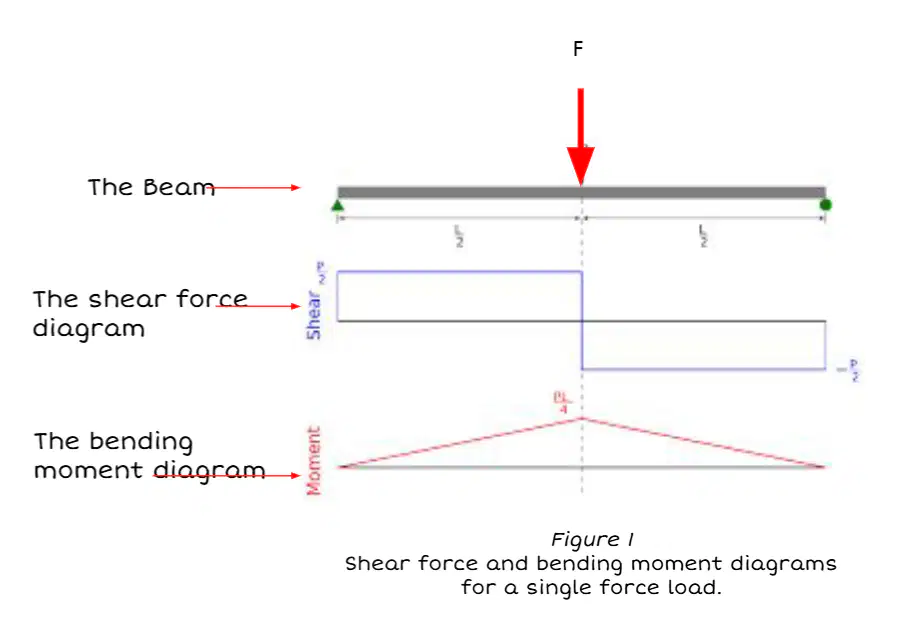
In the shear force and bending moment diagrams, what does the arrow labeled 'F' represent?
Shear Force
Bending Moment
Load
Reaction

What does the diagram represent?
A) Typical shear force and bending moment diagrams for a point loaded force
B) Stress-strain curve
C) Load-displacement graph
D) Force-time graph

Based on the diagram of Sample shape 2, what is the magnitude of the force applied at the second point?
5 kN
10 kN
15 kN
20 kN

What is the maximum shear force in the diagram?
5 kN
10 kN
15 kN

Fill in the blank: Maximum bending moment occurs at the point where SF crossed from ______ to negative.
positive.
zero.
neutral.
infinity.

Explain the typical shear force and bending moment diagrams for a uniformly distributed load (UDL) as shown in the diagram. Why is it important to understand these diagrams?
To understand the distribution of forces and moments in a structure
To calculate the weight of the structure
To determine the color of the structure
To find the height of the structure
Explain the process of constructing a shear force (SF) diagram as described in the instructions. Start from the LHS and follow the forces and direction at each point. Note that the SF diagram is plotted directly under the FBD.
Start from the RHS and follow the forces and direction at each point.
Start from the LHS and follow the forces and direction at each point.
Plot the SF diagram above the FBD.
Ignore the forces and direction at each point.
Construct a shear force diagram for a single point force, centrally loaded, as shown in the diagram with a 110kN force.
A shear force diagram with a single peak at the center
A shear force diagram with two peaks at the ends
A shear force diagram with a uniform distribution
A shear force diagram with a peak at one end
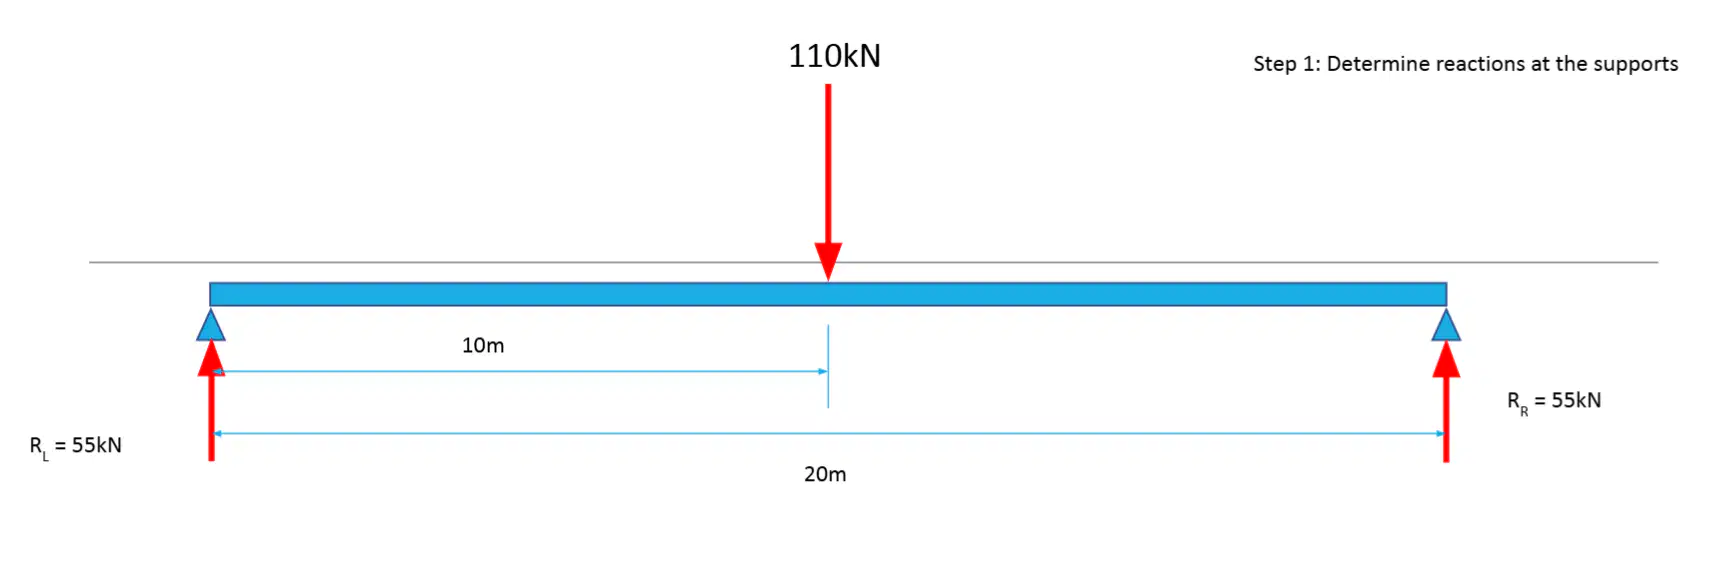
Determine reactions at the supports for the given beam with a central load of 110kN and support reactions R_L = 55kN and R_R = 55kN. The beam spans 30m with the load applied at 10m from the left support. What are the reactions at the supports?
R_L = 55kN, R_R = 55kN
R_L = 60kN, R_R = 50kN
R_L = 50kN, R_R = 60kN
R_L = 65kN, R_R = 45kN
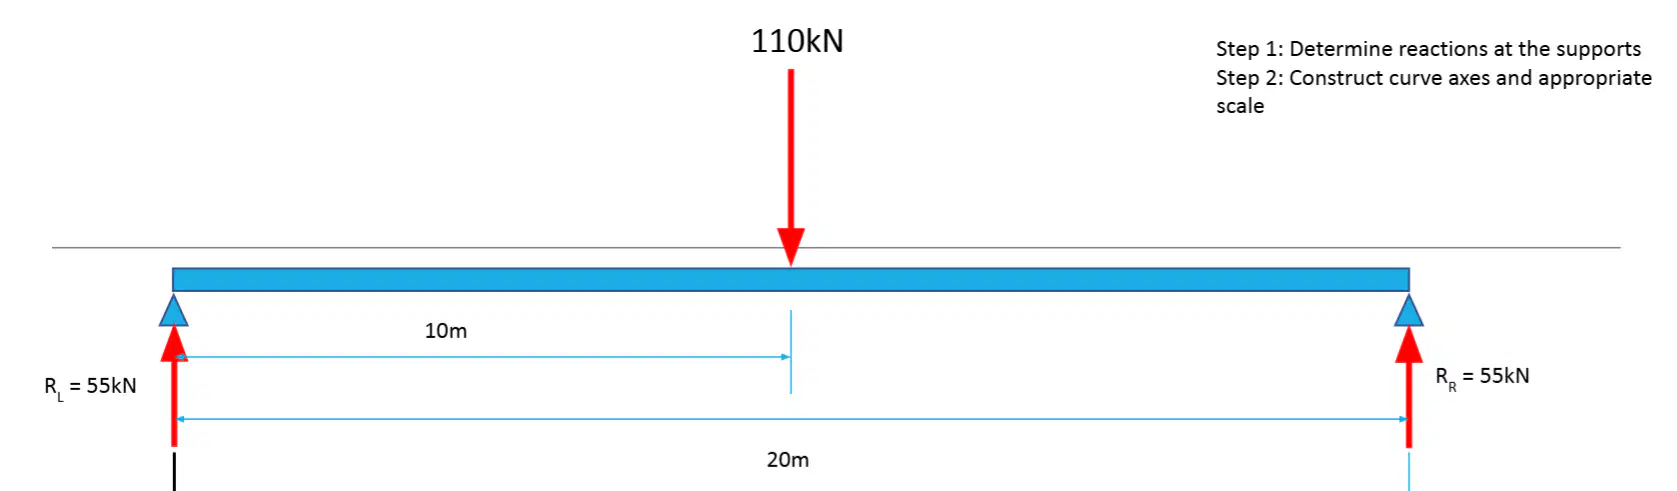
Step 1: Determine reactions at the supports. What are the reactions at the supports for the given beam?
Reaction at support A is 10 kN, Reaction at support B is 15 kN
Reaction at support A is 12 kN, Reaction at support B is 18 kN
Reaction at support A is 8 kN, Reaction at support B is 20 kN
Reaction at support A is 5 kN, Reaction at support B is 25 kN
Step 2: Construct curve axes and appropriate scale. How would you construct the shear force and bending moment diagrams for the given beam?
By using the method of sections and plotting the values along the beam.
By calculating the deflection at various points and plotting them.
By determining the support reactions and using them to plot the diagrams.
By measuring the physical beam and drawing the diagrams to scale.
Step 1: Determine reactions at the supports. What are the reactions at the supports in the given shear force diagram?
Reaction at support A is 10 kN, Reaction at support B is 20 kN
Reaction at support A is 15 kN, Reaction at support B is 25 kN
Reaction at support A is 20 kN, Reaction at support B is 30 kN
Reaction at support A is 25 kN, Reaction at support B is 35 kN
What is the value of the shear force at the midpoint of the beam?
The question has a diagram associated with it. The diagram has been stored separately.
Zero
Maximum
Minimum
Step 3: Follow the forces – if the force goes up, it is positive. Plot the value at each point on the shear force diagram.
True
False
Step 1: Using the same projected axes, apply appropriate scale below the shear force diagram. Explain how you would apply the scale to the shear force diagram shown in the image.
By using a ruler to measure and mark equal intervals.
By estimating the scale visually without any tools.
By using a digital tool to automatically apply the scale.
By applying a random scale without any reference.

Step 1: Using the same projected axes, apply appropriate scale below the shear force diagram. What is the shear force at point B?
10 kN
20 kN
30 kN
40 kN

What is the bending moment at point B?
0 Nm
550 kNm
110 kNm
55 kNm
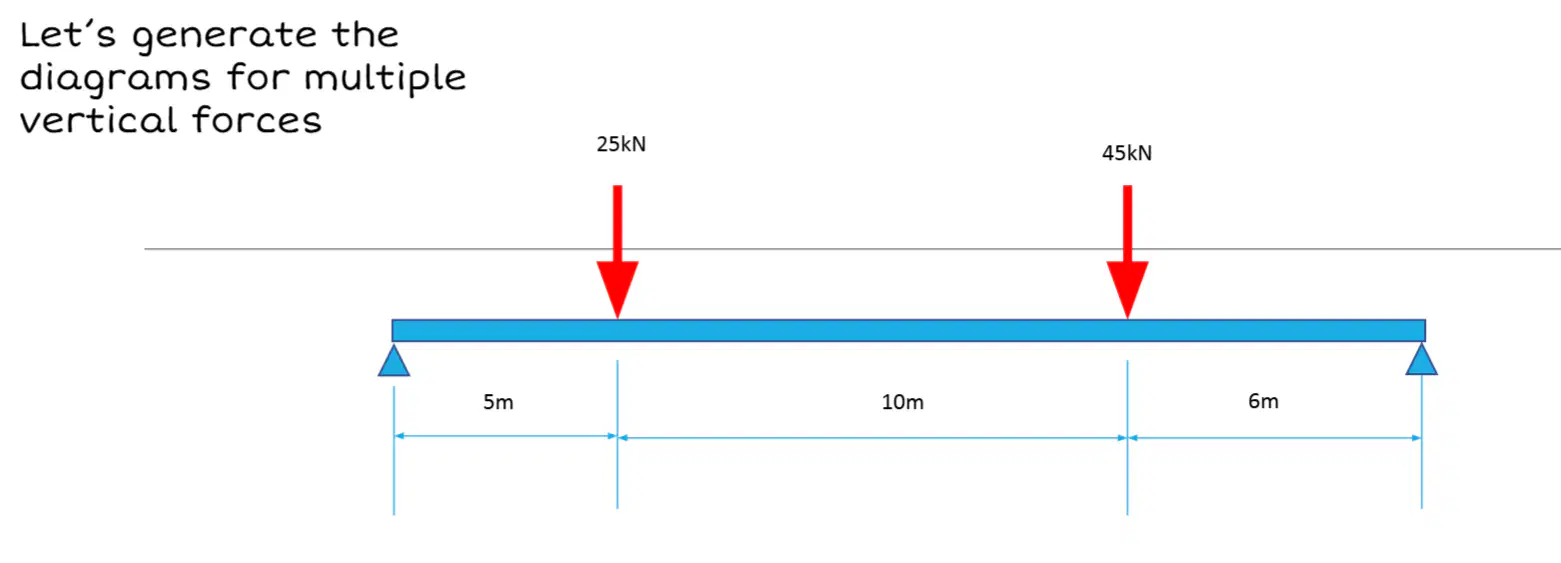
Using the diagram provided, calculate the reactions at the supports for the beam with forces of 25kN and 45kN applied as shown. Consider the distances between the forces and supports as 5m, 10m, and 6m respectively.
Reactions are 30kN and 40kN
Reactions are 35kN and 35kN
Reactions are 25kN and 45kN
Reactions are 20kN and 50kN

Determine reactions at supports. Use the given diagram and calculations to find the reactions at supports R_R and R_L.
R_R = 10 kN, R_L = 5 kN
R_R = 15 kN, R_L = 10 kN
R_R = 20 kN, R_L = 15 kN
R_R = 25 kN, R_L = 20 kN
Determine reactions at supports. Use the given diagram and calculations to find the reactions at the supports.
Reactions are 10 kN at A and 5 kN at B
Reactions are 15 kN at A and 10 kN at B
Reactions are 20 kN at A and 15 kN at B
Reactions are 25 kN at A and 20 kN at B
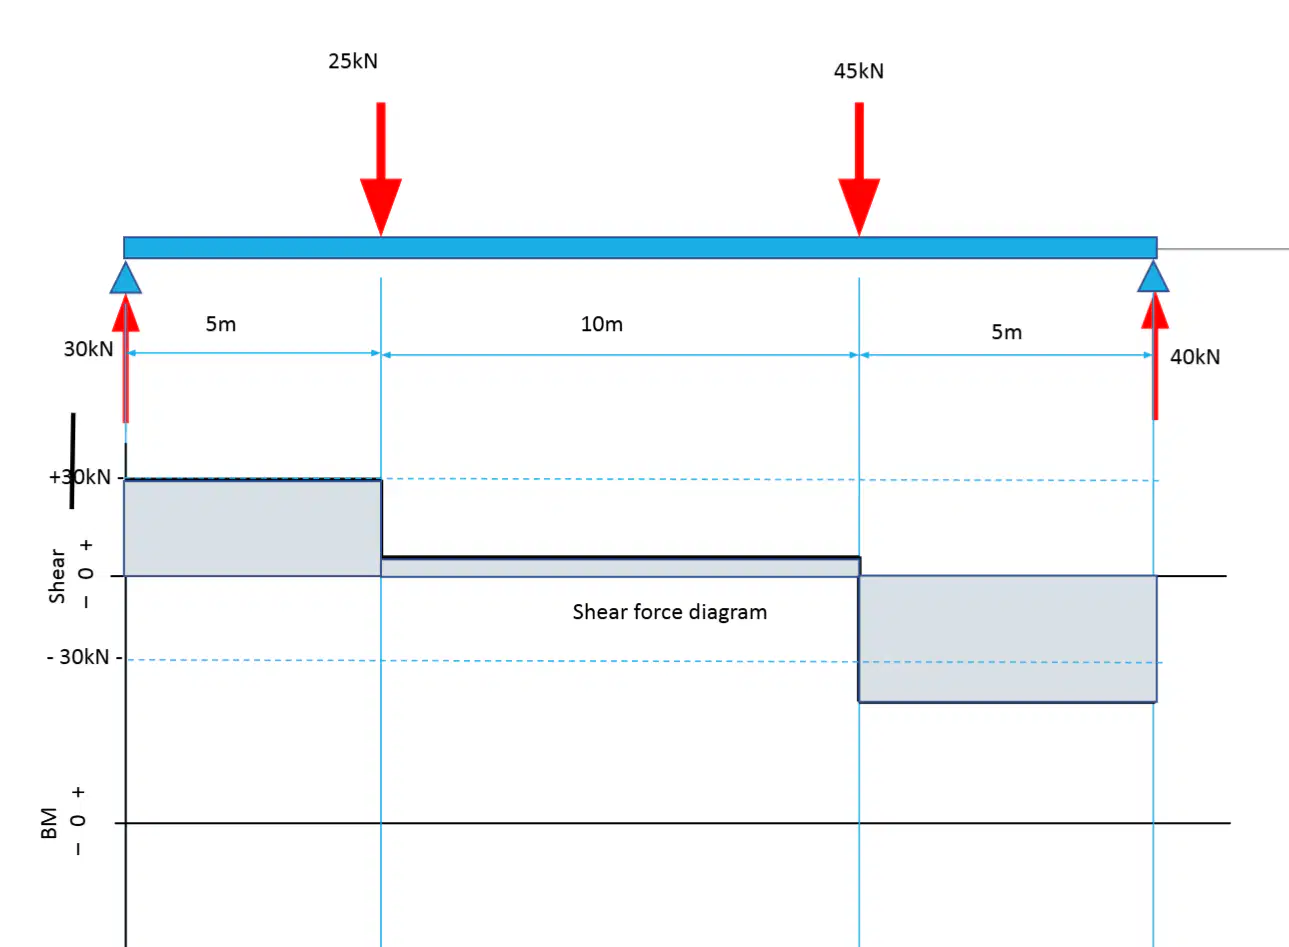
What is the shear force at the left support of the beam?
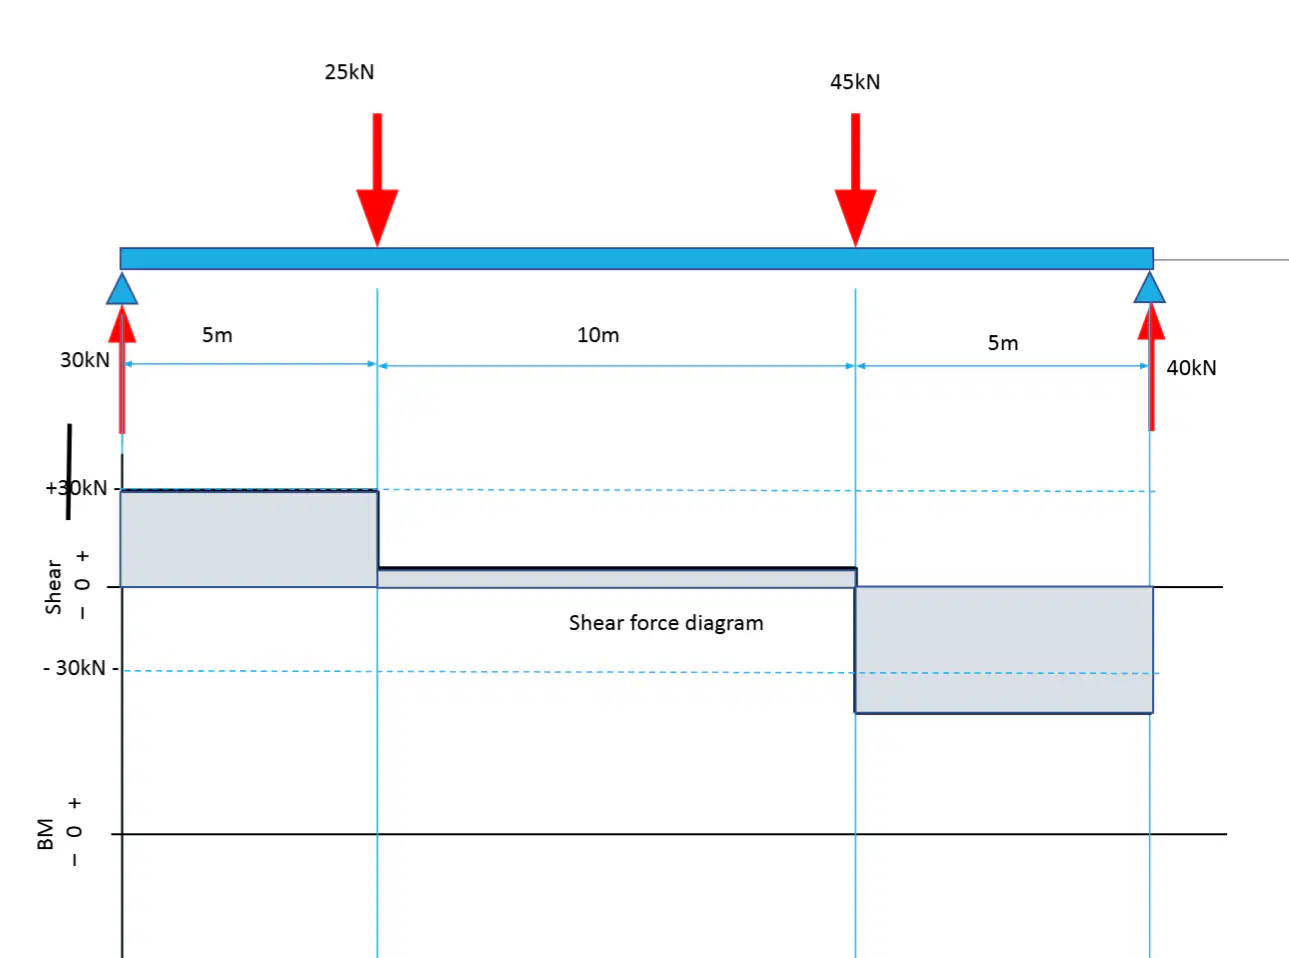
Calculate the bending moment at the center of the beam.
10 Nm
20 Nm
30 Nm
40 Nm

