
 Worksheets
SAT - Statistics and Probability Mash Up
Total questions: 103
Worksheet time: 5hrs 35mins
One group of subjects was given an herbal supplement and another group was given a placebo. After one year, the number of illnesses each group had was compared.
Observational Study
Experiment
A researcher stood at a school parking lot entrance to see if the color of a car is related to the driver not wearing a seatbelt.
Observational Study
Experiment
A professor finds that people who are obese have higher cholesterol levels than those who are not obese.
Observational Study
Experiment
Four groups of randomly selected people are assigned a different diet. After six months, the blood pressures of each group are compared.
Observational Study
Experiment
You want to see if students who have a 4.0 grade point average study more than those who do not.
experiment
observational study
You want to compare the health of students who walk to school to the health of students who ride the bus
experiment
observational study
A researcher randomly assigned boys and girls to each of two groups. One group was assigned to watch a violent television program while the other group watched a nonviolent program. The children's behavior was then recorded for incidences of aggressive behavior. This research method is best characterized as...
experimental
Observation
A psychologist designed a study to test the effects of cell phone use on driving safety. Participants were randomly assigned either to drive an automobile simulator while talking to a friend on a cell phone or to drive a simulator without talking on a phone.
Which type of research does the scenario describe?
Experiment
Observation
To test the effects of breakfast on grades I ask my students if they ate breakfast and then compare the breakfast eaters grades to the non-breakfast eaters.
This is an example of:
Observational study
Experiment
Researchers wanted to know if there is a link between proximity to high-tension wires and the rate of leukemia in children. To conduct the study, researchers compared the rate of leukemia for children who lived within 1/2 mile of high-tension wires to the rate of leukemia for children who did not live within 1/2 mile of high-tension wires.
Observational Study
Experiment
Rats with cancer are divided into two groups. One group receives 5 milligrams of a medication that is thought to fight cancer and the other receives 10 mg. After 2 years, the spread of cancer is measured.
Observational Study
Experiment
Identify each of the following as an observational study or an experiment.
Determine if people who take vitamin C every day are less likely to get colds.
Observational study
Experiment

. What is the probability that a student has a brother given that they do not have a sister?
*Write your answer as a fraction*
7/20
7/10
4/10
11/20

What is the probability that a student plays a sport given that they play an instrument?
*Write your answer as a fraction*
3/8
5/8
3/14
8/27

What is the probability that a student plays a sport or that they play an instrument?
*Write your answer as a fraction*
11/27
22/27
11/19
19/27
P(A∣B)=
P(A⋂B)/P(A)
P(A⋂B)/P(B)
P(A⋃B)/P(A)
P(A⋃B)/P(B)


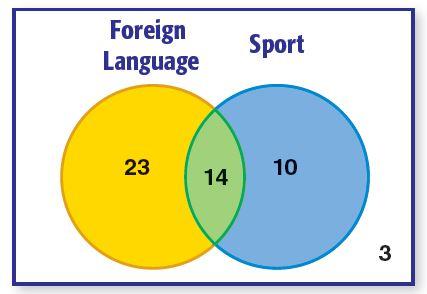

What is P(Ace given hearts)?
*convert your fraction to a percentage*
1.9%
7.7%
25%
6.3%

What is the probability of pulling an even number, given hearts and diamonds?
5/13
26/52
1/2
10/20
What is the probability of pulling a King, given spades?
1/13
1/4
1/52
4/52
A number is selected, at random, from the set {1, 2, 3, 4, 5, 6, 7, 8}.
Find P(odd given less than 7).
1/2
3/8
4/7
1/4
A box contains 3 blue marbles, 5 red marbles, and 4 white marbles. Find P(blue given not white).
3/8
1/4
5/12
5/8

A dice is tossed.
Find P(less than 5 | even number).
2/3
3/6
1/2
1/3
A dice is tossed.
Find P(2 | number greater than 3).
0
1/3
1/6
uhhh...
What is the unit rate if there are 1,760 Calories in 8 servings (calories per serving)?
(a)
A 6 oz. yogurt costs $0.89,
an 8 oz. yogurt costs $1.04,
a 10 oz. yogurt costs $1.69,
and a 32 oz. yogurt costs $4.79.
Which size yogurt has the best price per ounce?
6 oz
8 oz
10 oz
32 oz
The cost to rent a bike at Tropical Park is $25 for 1 hour. Which of the following statements are true? SELECT ALL THAT APPLY
$50 to rent a bike for 2 hours
$3 to rent a bike for 75 hours
$75 to rent a bike for 3 hours
$2 to rent a bike for 50 hours
The cost to rent a bike at Tropical Park is $25 for 1 hour. If the cost to rent a bike for 2 hours is $50 and the cost to rent a bike for 3 hours is $75, which of the following statements are true? SELECT ALL THAT APPLY
The example shows a proportional relationship.
The example shows a non-proportional relationship.
The constant is $25 per 1 hour.
The example shows a direct variation between the cost and hours to rent a bike.
The cost to order a pizza online is $5 per pizza plus a $3 delivery fee. That means that it will cost $8 to get 1 pizza delivered, $13 to get 2 pizzas delivered, and $18 to get 3 pizzas delivered. Does this show a proportional relationship?
Yes
No
Simplify the complex fraction:
41÷21
81
12=2
42=21
14=4
Simplify:
121÷43
89=181
126=21
612=2
23=121
Mikey is swimming a relay race. Here are his stats:
50 meters in 10 seconds
150 meters in 30 seconds
300 meters in 60 seconds
Is there a direct variation between the meters swam and seconds it took Mikey to swim those distances?
No
Not Enough Information
I like trains
Mikey is swimming a relay race. Here are his stats:
50 meters in 10 seconds
150 meters in 30 seconds
300 meters in 60 seconds
Is this a proportional relationship? If so, find the constant of proportionality?
Not a proportional relationship; no constant
It is a proportional relationship; no constant
It is a proportional relationship; the constant is 5 meters every 1 second.
Not a proportional relationship; the constant is 50 meters every 10 seconds.
Which of the following represent a proportional relationship? SELECT ALL THAT APPLY


What makes a graph proportional? SELECT ALL THE APPLY
Has to be a straight line.
As long as there is some kind of line, it is proportional.
Has to cross through the origin (0, 0).
Has to start from the negative side and move up to the positive side.

Does this graph show a direct variation? If so, what is the constant of variation?
Yes; the constant is $4 for every 12 apples.
Yes; the constant is $3 for every 1 apple.
No; no direct variation means there is no constant.
No; the constant is $12 for every 4 apples.

Is the relationship of this graph proportional or non-proportional?
Proportional
I like Turtles
Not Enough Information

Which of the following statements is true? SELECT ALL THAT APPLY
The constant is 60 miles for every 1 hour.
This demonstrates a direct variation between distance traveled and time.
This demonstrates a proportional relationship.
The graph shows that in 4 hours, 240 miles have been traveled.
The graph shows that in 180 hours, 3 miles have been traveled.

Which of the following statements is true? SELECT ALL THAT APPLY
The constant is $10 for every 1 picture.
This is not a proportional relationship.
This has a direct variation between pictures taken and the cost.
There is no constant in this graph.
There is no direct variation in this graph.
What is the constant of proportionality?
y = 14x
(a)
What is the constant of proportionality?
9y = 72x
(a)
Anthony opened a new store and wants to conduct a survey to determine the best store hours. Which is the best representative sample?
A group of randomly selected people who come to the store in one week.
A group of randomly selected people who visit his website on one night.
Every person he meets at his health club one night.
The first 20 people who walk into his store one day.
Becky wants to know if she should sell cranberry muffins at her bakery. She asks every customer who buys blueberry muffins if they would buy cranberry muffins. Is this a representative sample?
Yes, it does not include people who would buy cranberry muffins but do not like blueberry muffins
No, it does not include people who would buy cranberry muffins but do not like blueberry muffins
Yes, it does include people who would buy cranberry muffins but do not like blueberry muffins
No, it does include people who would buy cranberry muffins but do not like blueberry muffins
Simon wants to find out which shop has the best frozen fruit drink in town. How could Simon conduct a survey with a sample that is representative of the population?
Simon could stand outside a popular store in town that does not sell frozen fruit drinks and survey every fifth customer about their favorite local favorite fruit drink shop.
Simon could stand outside a popular store in town that does sell frozen fruit drinks and survey every fifth customer about their favorite local favorite fruit drink shop.

There are 400 students at Polly's school. She surveyed a random sample of 80 students to find their favorite hobby. 19 said they like to read. 30 said they like to be with friends. 8 said they like to do crafts. 23 said they like to play sports. Polly infers that doing crafts is the least popular hobby at her school.
Refer to the data table. Polly surveys two more samples. Do the results from these samples support the inference made from the first sample?
Yes, the survey results support the inference that doing crafts is the least popular hobby at Polly's school.
No, the survey results does not support the inference that doing crafts is the least popular hobby at Polly's school.
There are 400 students at Polly's school. She surveyed a random sample of 80 students to find their favorite hobby. 19 said they like to read. 30 said they like to be with friends. 8 said they like to do crafts. 23 said they like to play sports. Polly infers that doing crafts is the least popular hobby at her school.
Yovani estimates that about 200 students in the school favor playing sports as a hobby. Do you agree?
Yes, I used a proportion to find the number of students in the school who likely to prefer to play sports. 23/80 = 200/400; 200 students
No, I used a proportion to find the number of students in the school who likely to prefer to play sports. 23/80 = 115/400; 115 students

The two data sets show the number of days that team members trained before a 5k race. What inference can you draw by comparing the median?
There is more variability in the number of days that Team A members trained because the IQR for Team A is greater than the IQR for Team B.
There is more variability in the number of days that Team B members trained because the IQR for Team B is greater than the IQR for Team A.
Team A members generally trained for more days than Team B members
Team B members generally trained for more days than Team A members

What inference can you draw by comparing the interquartile ranges?
There is more variability in the number of days that Team A members trained because the IQR for Team A is greater than the IQR for Team B.
There is more variability in the number of days that Team B members trained because the IQR for Team B is greater than the IQR for Team A.
Team A members generally trained for more days than Team B members
Team B members generally trained for more days than Team A members

The dot plots show how long it took students in Mr. Chauncey's two science classes to finish their science homework last night. Find the means to make an inference about the data.
The 1st period mean is 35. The 2nd period mean is 38.75. On average, it took students in the 1st period class slightly longer to finish their homework than it did the students in the 2nd period class.
The 1st period mean is 38.75. The 2nd period mean is 35. On average, it took students in the 1st period class slightly longer to finish their homework than it did the students in the 2nd period class.
The 1st period mean is 35. The 2nd period mean is 38.75. On average, it took students in the 2nd period class slightly longer to finish their homework than it did the students in the 1st period class.
The 1st period mean is 38.75. The 2nd period mean is 35. On average, it took students in the 2nd period class slightly longer to finish their homework than it did the students in the 1st period class.

What can be the relationship statement for this scatter plot?
As the outside temperature increases, the ice cream sales increase.
Ice cream sales depend on temperature?
There is no relationship between sales and temperature.
As the outside temperature decreases, the ice cream sales increase.

Given this regression information, you can describe the correlation as
Weak Positive
Weak Negative
Strong Positive
Strong Negative

Using the line of best fit, what is the best estimation for the population in 1960?
150 million
180 million
160 million
200 million

The regression line equation for this date is y=1.4x+47 . What does the y-intercept represent in this scenario?
Students studied an average of 47 minutes
Students scored an average of 47 points when they studied
Students earned 1.4 more points when studying
Students who studied 0 minutes, earned an average of 47 points.

Given the regression information, the correlation can be described as
Weak Positive
Weak Negative
Strong Positive
Strong Negative

Given the regression information, what is the equation of the linear regression?
y = -3.28x + 55.5
y = -0.66x + 55.5
y = 55.5x - 3.28
y = 55.5x + 3.28

Which line matches the scatter plot the best?
A
B
C
D
NONE

The graph shows a line of best fit for data collected on the amount of income earned by lawn companies in relation to the number of yards mowed. What is the equation of the trend line?
Look at the scale on each axis.
y=23x
y=30x
y=32x
y=300x

The scatter plot shows the relationship between the number of chapters and the total number of pages for several books. Use the trend line to predict how many chapters would be in a book with 140 pages.
12 Chapters
14 Chapters
19 Chapters
21 Chapters

What type of association does this graph have?
Positive
Negative
None
Not enough information

What's a reasonable estimation of the correlation coefficient of this data?
.9502
1.239
-.9271
.5923

What type of correlation?
Positive
Negative
None
Not enough information

What percentage of males drive sports cars?
35%
16.25%
25%
65%

What is the relative frequency of people that purchased no food?
10%
60%
15%
30%

How many students were surveyed in the "Biking to School" two-way table?
16
14
11
30

The scatter plot shows the number coffee shops in different cities and the number of violent crimes. Which of the following is NOT true?
A) As the number of coffee shops increase, violent crimes appears to increase.
B) An increase in coffee shops causes an increase in violent crimes
C) The data has a positive correlation coefficient
D) The line of best fit (regression line) shows a positive correlation

Determine the line of best fit for the data shown.
y = −10.63x−3.80
y=3.88x−10.63
y=3.87x+0.90
y=3.88x−11

A student who waits on tables at a restaurant recorded the cost of meals and the tip left by single diners. If the next diner orders a mean costing $14.50 , how much tip should the waiter wait to receive.
$1.55
$1.72
$1.98
$2.25

The table shows the height of a tree for various years after it was planted. Using the line of best fit, how tall would the tree be 30 years after it was planted?
22
23
36
37

Determine the Correlation Coefficient and decide whether it is weak, moderate, or strong.
0.07 weak
-0.26 weak
-0.26 moderate
0.07 strong
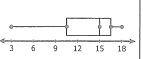
Which of the following best describes the shape of the distribution?
skewed left
skewed right
uniform
symmetrical
Should we use the mean or the median to represent the center of the data?
Median
Mean
Mode
Standard Deviation
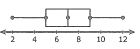
Which of the following best describes the shape of the distribution?
skewed left
skewed right
uniform
symmetrical
Given that the data is symmetric, which pair of measures should be used to represent the data?
center: median
spread: standard deviation
center: mean
spread: IQR
center: mean
spread: standard deviation
center: median
spread: IQR

Which of the following best describes the shape of the distribution?
skewed left
skewed right
uniform
symmetrical

Find the IQR of the distribution.
(only type in the number)
2
15
17
6
12
The range is the difference between the maximum and minimum values.
True
False

Which describes the shape of the distribution?
skewed right
skewed left
symmetric
uniform

Which measure of center will be the smallest?
(Remember which one pulls toward the tail)
median
mean
mode

Which measure of spread should be used to describe the distribution?
standard deviation
interquartile range
range
median
The distribution shown is symmetric and we should use the mean and the standard deviation to describe the center and spread.
True
False

Describe the shape of the graph.
skewed
symmetrical
uniform
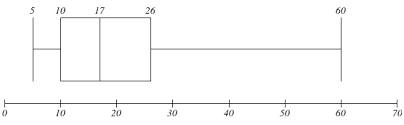
This distribution is ......
Skewed right
skewed left
Symmetrical
Uniform

Find the interquartile range?
8
6
5
4

What is the shape of the distribution?
symmetric
uniform
skewed to the right
skewed to the left

Because this distribution is ____________ to the ___________, we would use the ______________ for the center and the _____________ for the spread of the data.
symmetric, middle, median, IQR
skewed, left, median, IQR
skewed, left, mean, IQR
skewed, right, median, standard deviation
Check all that apply:
The IQR is the
max - min
Interquartile Range
measure of spread that pairs with the mean
Q3 - Q1

Which distribution has a larger Interquartile Range?
A
B
They are the Same

Which distribution has the largest median?
A
B
C
None

Which distribution has the smallest IQR? What is the value of the IQR?
C, IQR= 20
B, IQR= 5
A, IQR= 6

Distribution B is ______________
symmetric
skewed left
skewed right
uniform

If a ball needs to be hit exactly 300 ft, which batter is more reliable to hit that distance?
Batter A
Batter B
Both
Neither

The ages of the employees at which company tend to be lower than the other?
Company A
Company B
A data set has the following values: 4, 8, 6, 5, 3. Calculate the standard deviation of this data set.
1.58
2.00
1.41
1.87
Which of the following statements best describes a standard deviation of 0?
All data points are different.
All data points are the same.
The data set has a large spread.
The data set has outliers.
Consider two data sets: Set A with a standard deviation of 2.5 and Set B with a standard deviation of 5.0. Which set has more variability?
Set A
Set B
Both have the same variability.
Cannot be determined from the given information.
A data set has a mean of 50 and a standard deviation of 5. Which of the following values is an outlier?
55
60
70
45
In a real-world scenario, a company measures the time taken by employees to complete a task. The standard deviation of the times is 3 minutes. What does this indicate?
Most employees take exactly 3 minutes to complete the task.
The time taken by employees varies by about 3 minutes from the average.
All employees take the same amount of time to complete the task.
The task is completed in less than 3 minutes by all employees.
The data sets show the test scores of a group for the last two tests.
Test 1: {75, 75, 85, 80, 65, 70, 65} Test 2: {95, 85, 85, 90, 90, 95, 100}
Which data set had the SMALLER standard deviation?
Test 1 with a standard deviation of 6.9
Test 2 with a standard deviation of 6.9
Test 1 with a standard deviation of 5.2
Test 2 with a standard deviation of 5.2

