
 Worksheets
U3L3b HW Econ
Total questions: 28
Worksheet time: 7hrs 0mins
Drawing supply and demand curves on a graph involves:
Labeling the axes and plotting both supply and demand curves.
Drawing only the supply curve.
Drawing only the demand curve.
Labeling the axes without drawing any curves.
Before the change: Label original equilibrium price and quantity.
Label the point where the supply and demand curves intersect as the original equilibrium price and quantity.
Label the highest point on the supply curve as the original equilibrium price and quantity.
Label the lowest point on the demand curve as the original equilibrium price and quantity.
Label any random point on the graph as the original equilibrium price and quantity.
Label the new equilibrium price and quantity after the change.
At the intersection of the new supply and demand curves
At the original equilibrium point
At the highest price on the graph
At the lowest quantity on the graph
What happens to the supply and demand of hamburgers?
Supply increases, leading to a lower equilibrium price and higher equilibrium quantity.
Supply decreases, leading to a higher equilibrium price and lower equilibrium quantity.
Demand increases, leading to a higher equilibrium price and higher equilibrium quantity.
Demand decreases, leading to a lower equilibrium price and lower equilibrium quantity.
Scenario 2: Price of chicken sandwiches (a substitute) increases. What happens to the supply and demand of hamburgers?
Demand for hamburgers increases, leading to a higher equilibrium price and quantity.
Supply of hamburgers decreases, leading to a lower equilibrium price and quantity.
Demand for hamburgers decreases, leading to a lower equilibrium price and quantity.
Supply of hamburgers increases, leading to a higher equilibrium price and quantity.
A decrease in the price of hamburgers leads to which of the following changes in supply and demand?
An increase in quantity demanded and a decrease in quantity supplied
A decrease in quantity demanded and an increase in quantity supplied
A shift of the demand curve to the right
A shift of the supply curve to the right
If the price for ground beef triples, what happens to the supply and demand of hamburgers?
Supply of hamburgers increases, leading to a lower equilibrium price.
Supply of hamburgers decreases, leading to a higher equilibrium price and lower equilibrium quantity.
Demand for hamburgers increases, leading to a higher equilibrium quantity.
There is no effect on the supply or demand of hamburgers.
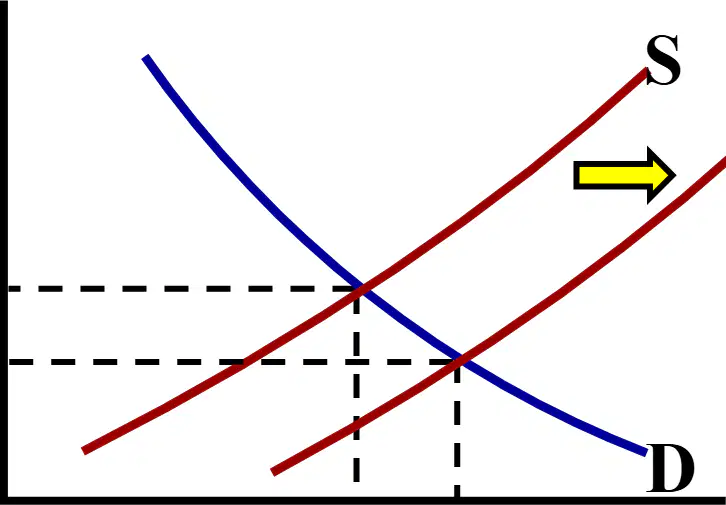
The graph shows the effect of new grilling technology that cuts production time in half. What happens to the equilibrium price and quantity as a result of this technological improvement?
Price increases, Quantity decreases
Price decreases, Quantity increases
Price and Quantity both increase
Price and Quantity both decrease
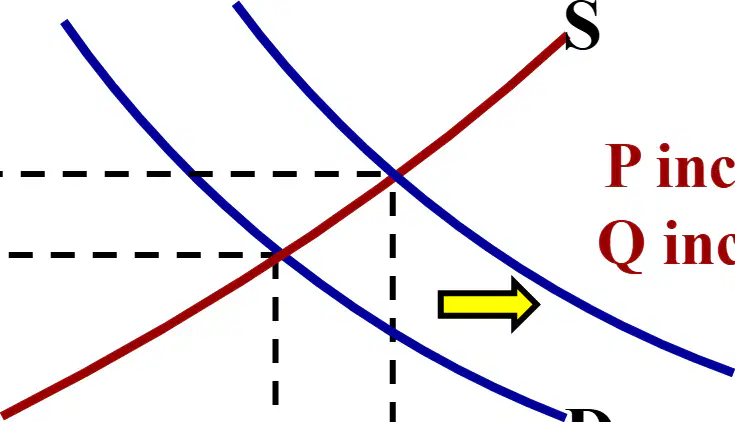
Given the scenario: 'Price of chicken sandwiches (a substitute) increases.' Refer to the supply and demand graph. What happens to the equilibrium price and quantity of the good shown in the graph?
Price increases, Quantity increases
Price decreases, Quantity decreases
Price increases, Quantity decreases
Price decreases, Quantity increases
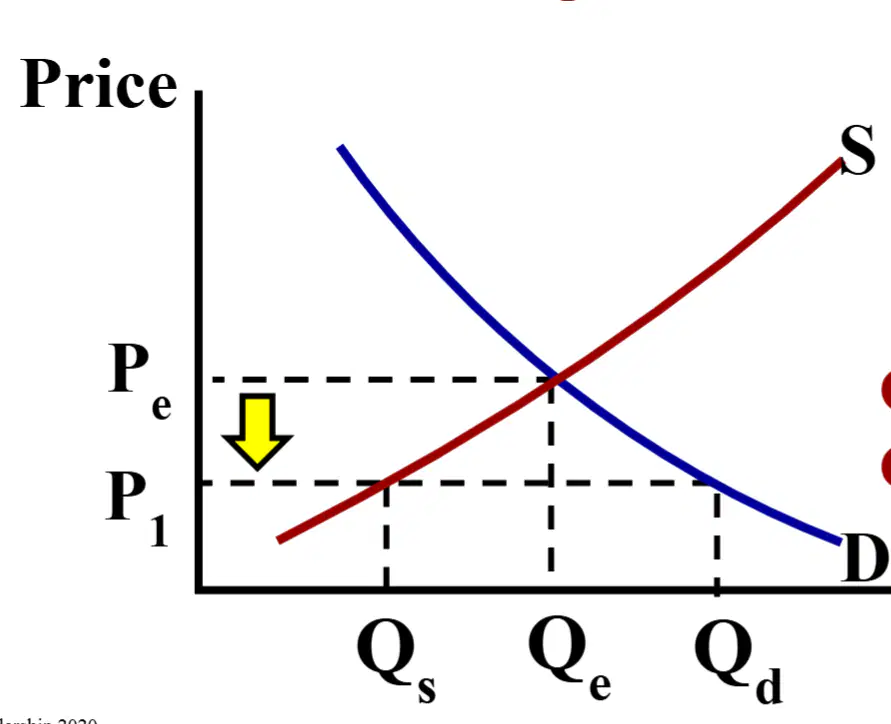
What is the market condition that results from this price decrease?
Surplus
Shortage
Equilibrium
No change
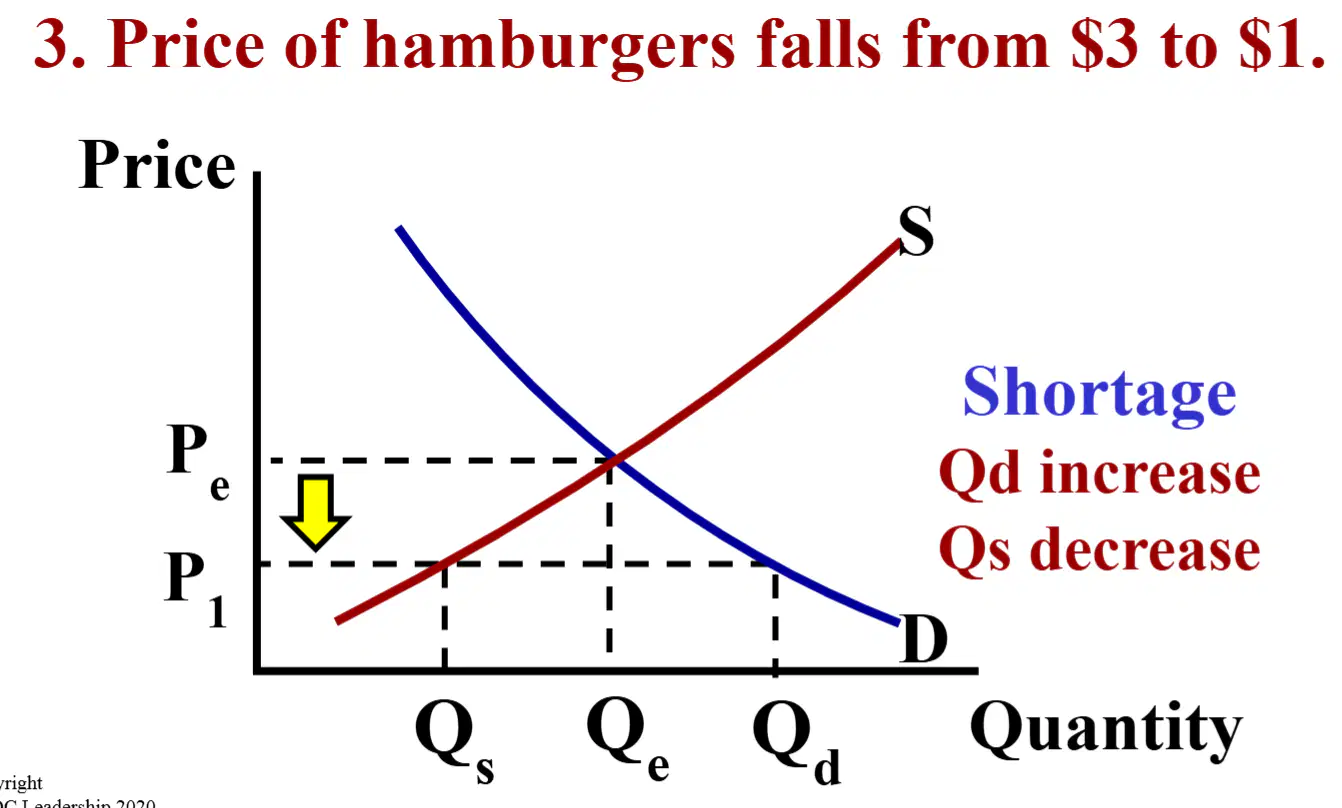
Refer to the diagram showing the price of hamburgers falling from 3to 1. When the price falls below equilibrium, what happens to the quantity demanded (Qd) and the quantity supplied (Qs)?
A) Qd increases, Qs decreases
B) Qd decreases, Qs increases
C) Both Qd and Qs increase
D) Both Qd and Qs decrease
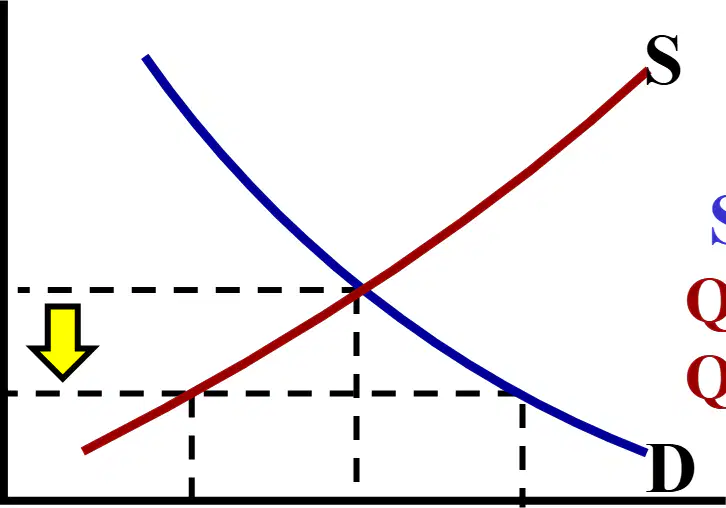
Refer to the diagram showing the price of hamburgers falling from 3to 1. Fill in the blank: When the price falls below equilibrium, a _______ occurs in the market.
shortage
surplus
equilibrium
substitution
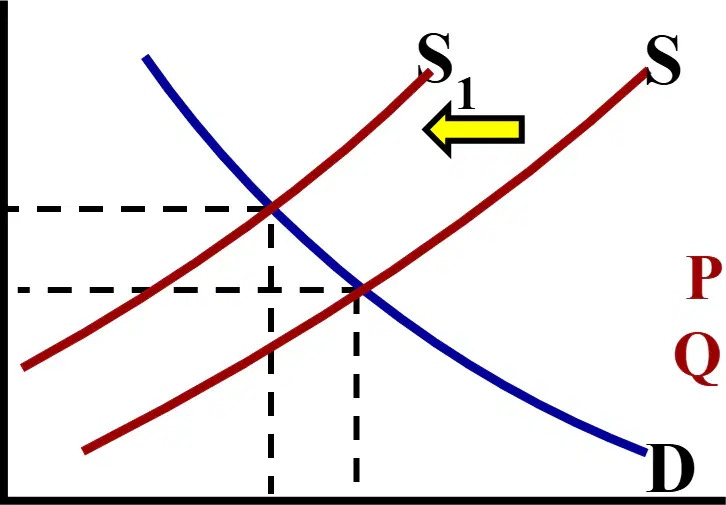
When the price for ground beef triples, what happens to the supply curve?
It shifts to the right
It shifts to the left
It does not shift
It becomes vertical
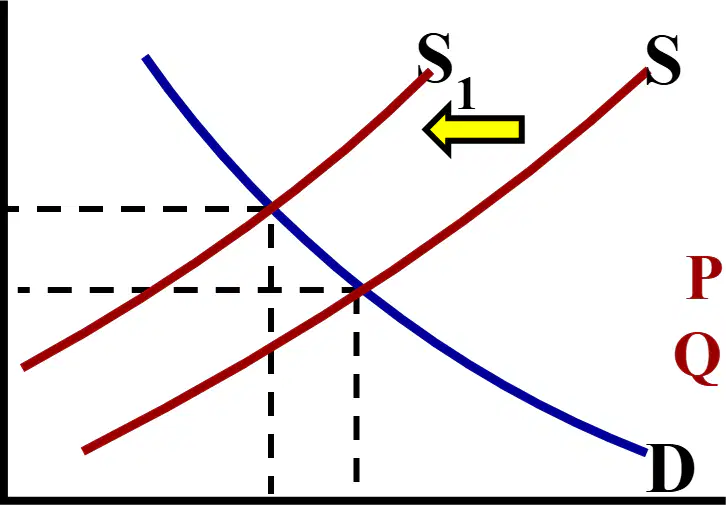
As a result of the supply curve shifting from S to S1, what happens to the equilibrium price and quantity?
Price increases, quantity increases
Price increases, quantity decreases
Price decreases, quantity increases
Price decreases, quantity decreases
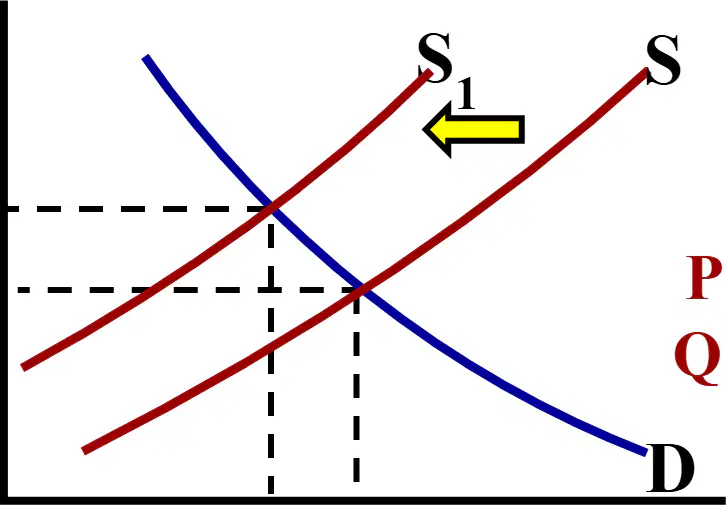
In the graph, the new equilibrium price after the supply curve shifts is labeled as _____
P1e
P2e
P3e
P0e
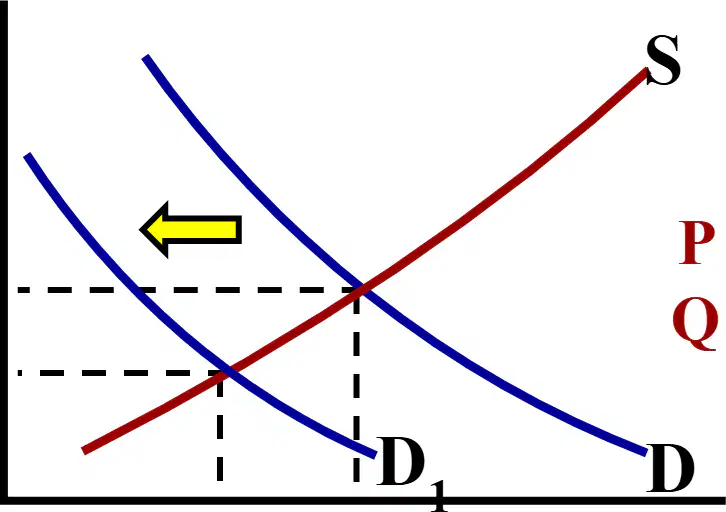
E. coli found in multiple burger restaurants. Refer to the supply and demand graph shown. What happens to the equilibrium price and quantity of burgers after the news of E. coli contamination?
Price increases, Quantity increases
Price increases, Quantity decreases
Price decreases, Quantity increases
Price decreases, Quantity decreases
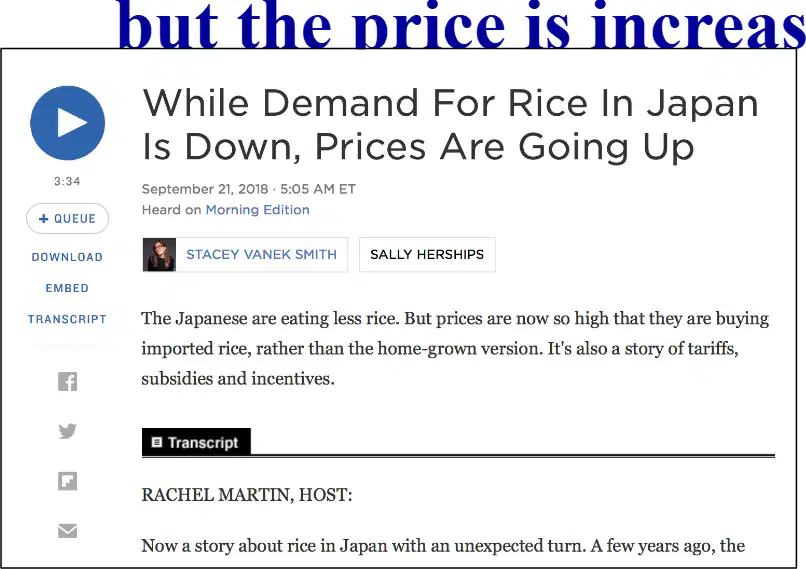
The demand for rice in Japan is falling, but the price is increasing mainly because of:
Increased consumption of rice
High prices, tariffs, subsidies, and incentives
Decrease in rice imports
Improved rice production
Which of the following best represents the equilibrium in the market for computer games?
The point where the supply and demand curves intersect
The highest point on the demand curve
The lowest point on the supply curve
The area between the supply and demand curves
Use Economic Analysis to determine what happens to the price and quantity of computer games in each scenario. Scenario 1: It becomes known that an electronics store is going to have a sale on their computer games 3 months from now. What happens to the current demand for computer games and what is the demand shifter?
Demand increases now; demand shifter: income.
Demand decreases now; demand shifter: expectations of future prices.
Supply increases now; supply shifter: technology.
Supply decreases now; supply shifter: input prices.
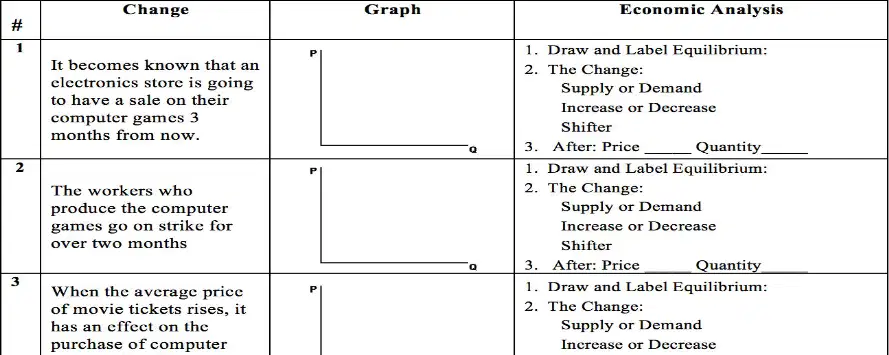
In Scenario 2, what should be drawn and labeled to show the equilibrium for the market of computer games?
A bar chart showing sales over time
A pie chart of market share
A supply and demand graph with the equilibrium point labeled
A line graph of worker wages
Use Economic Analysis to determine what happens to the price and quantity of computer games in each scenario. Scenario 2: The workers who produce the computer games go on strike for over two months. What is the change in the market?
Supply increases
Supply decreases
Demand increases
Demand decreases
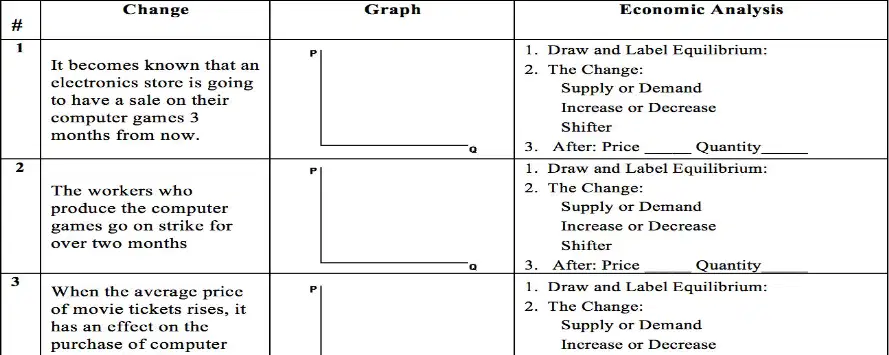
Use Economic Analysis to determine what happens to the price and quantity of computer games in each scenario. Scenario 3: When the average price of movie tickets rises, it has an effect on the purchase of computer games. What should be drawn and labeled to show the equilibrium?
A bar graph showing sales over time
A pie chart of market share
A supply and demand graph with the equilibrium point labeled
A timeline of price changes
When the average price of movie tickets rises, what happens to the demand for computer games?
Demand increases; demand shifter: substitute goods
Demand decreases; demand shifter: complementary goods
Supply increases; supply shifter: technology
Supply decreases; supply shifter: input prices
Use Economic Analysis to determine what happens to the price and quantity of computer games in each scenario. Scenario 3: When the average price of movie tickets rises, it has an effect on the purchase of computer games. 3. After: Price _____ Quantity _____
Price increases, Quantity increases
Price decreases, Quantity decreases
Price increases, Quantity decreases
Price decreases, Quantity increases
The demand for turkey around Thanksgiving:
increases
decreases
stays the same
disappears
The supply of turkeys around Thanksgiving:
remains the same as other times of the year.
decreases significantly.
may increase as producers prepare for higher demand, but it may not increase as much as demand.
becomes unlimited.
Based on your answers, what do you think will happen to the price of turkey at Thanksgiving?
The price of turkey will likely increase at Thanksgiving due to higher demand.
The price of turkey will likely decrease at Thanksgiving due to lower demand.
The price of turkey will stay the same at Thanksgiving.
The price of turkey will not be affected by Thanksgiving.

Supply and demand operate in the story by showing how individual actions and decisions, without central coordination, lead to the creation of a loaf of bread. What is the result of these actions?
A centrally planned outcome
An organized outcome through emergent order
A random and chaotic result
No outcome at all

