
 Worksheets
Unit 10 Review
Total questions: 113
Worksheet time: 9hrs 25mins
Hector surveyed 500 people and asked them how far they drive to work and what the last digit of their phone number is. He used the results to make a scatter plot. What type of association should he expect to see in the scatter plot?
Positive Association
Negative Association
No Association
Jules conducted a survey and asked 100 people how many years of education they have and what their annual income is. She used the results to make a scatter plot. What type of association should he expect to see in the scatter plot?
Positive Association
Negative Association
No Association

Which best describes the association shown in the scatter plot?
Positive Association
Negative Association
No Association

Which best describes the association shown in the scatter plot?
Positive Association
Negative Association
No Association

Which best describes the association shown in the scatter plot?
Positive Association
Negative Association
No Association

Which best describes the association shown in the scatter plot?
Positive Association
Negative Association
No Association

Which scatter plot could be used to show the relationship between a person's age and a person's height?
#3
#4
#5
#6

Which best describes the association shown in the scatter plot?
Negative and linear
Negative and non-linear
Positive and linear
Positive and non-linear
Which would NOT likely be the variables represented on the scatter plot?
The number of miles driven and the gallons of gas used.
The number of students in a school and the number of unused lockers.
The number of items ordered at a restaurant and the cost of the bill.
The number of customers in a store and the length of the wait at the register.

Which scatter plot appears to be linear?
Scatter Plot A
Scatter Plot B

Describe the association for the graph.
Linear and Positive
Linear and Negative
Non-Linear and Negative
Non-Linear and Positive
Non-Linear and No Association

Describe the association for the graph.
Linear and Positive
Linear and Negative
Non-Linear and Positive
Non-Linear and Negative
Non-Linear and No Association


Which best describes the form of this scatterplot?
linear
nonlinear
scattered
no correlation


The scatter plot shows the number coffee shops in different cities and the number of violent crimes. Which of the following is NOT true?
A) As the number of coffee shops increase, violent crimes appears to increase.
B) The line of best fit (regression line) shows a positive correlation
C) The data has a positive correlation coefficient
D) An increase in coffee shops causes an increase in violent crimes
Which scatterplot does NOT suggest a linear relationship between x and y?


Find the slope (m)
m = 3
m = 1/3
m = -2
m = 2

Find the slope (m)
m = 4
m = 0
m = undefined
m = 1

Find the slope (m)
m = 5
m = 4.5
m = 0
m = undefined

Find the slope (m)
m = -4
m = 32
m = 23
m = −32
m = −23

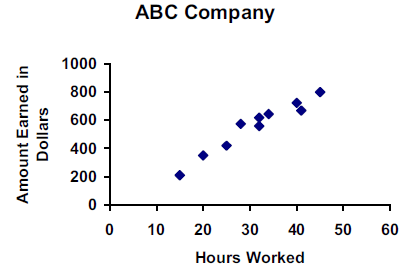

Marni recorded the cost of different weights of apples and made a scatter plot of her data. Based on the data, what is the best prediction of weight for apples that cost $18?
11 pounds
9 pounds
7.5 pounds
10 pounds
Which of the following best models a linear function fitted to the data in the scatter plot?


Which is the outlier?
(30, 43)
(30, 21)
(0, 35)
(20, 12)

The two-way frequency table shows data on having a curfew and having assigned chores at home.
Which of the following statements is true?
The majority of students have a curfew.
If a student has a curfew, it is more likely that they have chores.
More than half the students do not have chores and do not have a curfew.
If a student does not have chores, it is more likely that they have a curfew.

The two way relative frequency table shows data on nationality and eye color. Based on the table which statement must be true?
There are the same number of English people and Italian people with other eye colors.
Italians are more likely to have brown or hazel eyes than Germans are.
A German person is more likely to have brown or hazel eyes than to have blue or green eyes.
A person with brown or hazel eyes is least likely to be German.

The test results of 66 students were compared to whether the students completed a provided review sheet.
Is there an association between completing the review sheet and passing the test?
Yes, it was more likely that students who failed, completed the review sheet
Yes, it was more likely that students who passed, completed the review sheet
No, there is no association

Is there an association between grade level and whether or not a student has a driver's license?
Yes, juniors are more likely to have a license than seniors.
Yes, seniors are more likely to have a license than juniors.
No, there is no association between grade level and having a license.

Based on the two way relative frequency table, is there an association between gender and whether or not a person prefers Hip Hop or Country?
Yes, males are more likely to listen to hip hop than females.
Yes, females are more likely to listen to hip hop than males.
No, there is no association between gender and music preference.

This graph has...
Clusters
outliers

This graph has...
A cluster and an outlier
An outlier
A gap and an outlier
A cluster

Identify any clusters.
Cluster at x = 14
Cluster at x = 18
Cluster at x = 24
There aren't any noteworthy clusters in this graph.

What are the coordinates of the outlier?
(1,9)
(9,1)
(2,2)
y=x


Is this line an accurate line estimate of best fit for the data?
Yes
No

Is this line an accurate line estimate of best fit for the data?
Yes
No


What is the equation of the line of best fit?
y= 2x
y=3x+7
y= 21x +3
y= −21x −3


What is the equation of the line of best fit?
y = 3/2x
y = 30x
y = 30x + 300
y = 3/2x + 300
Suppose data related to the AVERAGE Temperature outside (T) and the number of winter Coats (C) sold at a store is collected and graphed.
The LINE OF BEST FIT has the equation C = -3T + 150.
Use this equation to predict the number of coats sold when the average temperature outside is 20°.
40
75
90
115
Suppose a LINE OF BEST FIT passes through the points (4, 8) and (6, 2). The SLOPE of this line is . . .?
-3
-6
4
2
Students in a group of chess teams submitted data about hours of team practice and the number of matches the team won. The graph shows the results of the data. Based on the linear regressions equation y = 3.14x + 3.52, if a team practices 4.5 hours per week next year, which is the best prediction of the number of chess matches a team could expect to win?
about 24
about 12
about 8
about 18

The equation of the trend line is y= 1/2x +1
How many laps can a bicycle make around the park in 23 minutes?
44 laps
12 1/2 laps
23 laps
Using the model 𝘺 = 𝟦𝟩.𝟪𝟩𝘹 + 𝟣𝟥𝟦𝟧.𝟢𝟦, where x is the number of years after 1975 and y is in thousands of miles, estimate the number of miles people flew on the airline in 2008.
x=1425.91
x=5375.91
x=95888.29
x=2924.75
x=97468


What is the equation of the line of best fit?
y= −21x + 6
y= 21x +6
y= 6x + 2
y = -2x +6
The linear model to represent the distance (in miles) traveled given the time (in hours) driving is
m=−1.79+61.93h . Predict how far a person will travel driving 10 hours.617.51 miles
621.09 miles
100 miles
0.19 miles

What number should go in the blue box?
21
135
19
22

How many total have no cell phone?
13
9
22
100

How many total people were surveyed?
78
22
70
100

35 children were asked if they prefer cats or dogs. The data is shown in the table. How many girls prefer dogs?
Don't have enough information
2
23
29

Which sport is least popular?
netball
rugby
cricket
rugby and netball

How many Bachelor's Degrees were given?
46
51
97
5

How many Males have Masters/Doctoral Degree?
16
3
46
62

How many female students are taking physics?
14
19
33
24

This table shows the number of female and male students in each science class. How many students are taking biology?
18
8
80
26

How many male students were surveyed?
23
47
80
33
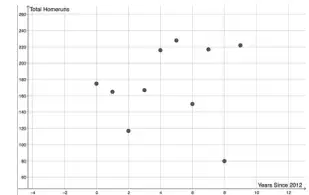
The scatter plot shows the total amount of homeruns made by the Tampa Bay Rays in regular seasons from 2012 to 2021. The point (4, 216) is on the scatter plot. Interpret the meaning of this point in context.
The Tampa Bay Rays made 216 homeruns in the 4th game of the season.
The Tampa Bay Rays made 216 homeruns in the 4th month of the year.
The Tampa Bay Rays made 216 homeruns in the 4th year of the given period.
The Tampa Bay Rays made 2016 homeruns in the 4th inning of a game.
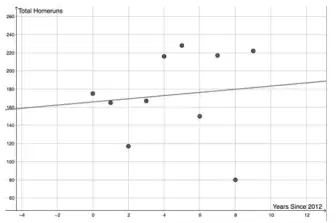
Suppose the line shown is fit to the data. The equation of the line of fit is y = 1.8x + 165.8. What does the slope represent in this context?
The number of homeruns increases by an average of 1.8 for each year since 2012
The number of homeruns in 2012 for each increasing 1.8
The slope represents the maximum value of y.
The slope represents the minimum value of x.
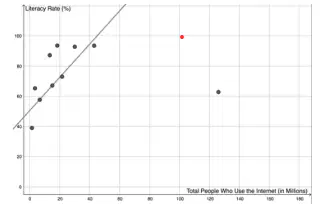
Suppose the line shown is fit to the data. The equation of the line of fit is y = 1.1x + 50.5. Interpret the meaning of the slope in context.
The literacy rate increases by 1.1% for each additional 1 million internet users.
The literacy rate increases by 50.5% for each additional 1 million internet users.
The literacy rate decreases by 1.1% for each additional 1 million internet users.
The literacy rate remains constant regardless of internet usage.

is y= 1/2x +1
How many laps can a bicycle
make around the park in
23 minutes?

Which relationship is shown by this scatter plot?
As the cost goes down, the number sold goes
down.
As the cost goes up, the number sold goes
down.
As the cost does down, the number sold
remains the same.
There is no relationship between cost and the
number sold.

The table shows the height of a tree for various years after it was planted. The line of best fit for the data is y=0.96x+8.47 . What does the slope represent?
Every 8.47 years, the tree grows 1 foot.
Every year, the tree grows 8.47 feet.
Every 0.96 years, the tree grows 1 foot.
Every year, the tree grows about 0.96 ft.
The equation y=1.3x+27 models the month, x, and ticket sales, y (in thousands) of movie tickets sold from January to June for a theater. In the equation, x = 1 represents January. Identify and interpret the slope in the context of the situation.
slope=1.3; The theater's sales increase by $1,000 every 1.3 months.
slope=1.3; The theater's sales increasing by about $1,300 every month.
slope=27; The theater's sales increasing by about $27,000 every month.
slope=27; The theater's sales increase by $1,000 every 27 months.
The equation y=4.87x−37.67 represents the lengths (feet), x, and costs(in thousands of dollars), y, of several sailboats. Interpret the slope in the context of the problem.
The slope of 4.87 represents a total cost of $4,870 for any sailboat length.
The slope of 4.87 indicates an increase of 4.87 feet of sailboat length for every $1000 increase in price.
The slope of 4.87 indicates a decrease of $4,870 in cost for each additional foot of sailboat length.
The slope of 4.87 represents an increase of $4,870 in cost for each additional foot of sailboat length.

The scatter plot shows the number of minutes people had to wait (y) for service at a restaurant and the number of staff (x) available at the time. The line of best fit is y = -1.62x+18. Interpret the slope in this situation
The staff members decrease 1.62 people per minute.
The staff members increase 1.62 people per minute.
The wait time decreases 1.62 minutes per staff member.
The wait time increases 1.62 minutes per staff member.
Simplify:
1096406
1606
9610
6016
Which is equivalent to ∛375 in simplest form?
3∛5
5∛25
3∛125
5∛3

A
B
C
D


A
B
C
D
Simplify and then subtract:
3√2 - 3√18
-4√8
4√9-6√3
5√12
-6√2
12+518+227
83+152
82+153
252
2150+3175+424
26+157
186+157
1713

A
B
C
D
√3 ( 4√5 + √12)
4√15 + √36
4√15 + 6
12√5 + √40
4√8 + √15
Simplify: 3(2−15)
2 3−35
−2
6−45
−39
2(410−66)
810−612
412−68
420−612
85−123
Simplify
26(53+4)
302+86
388
762
230+68

15. Simplify
2a2b6
2a2b61
2a2b6
a22b6
(2mp)3


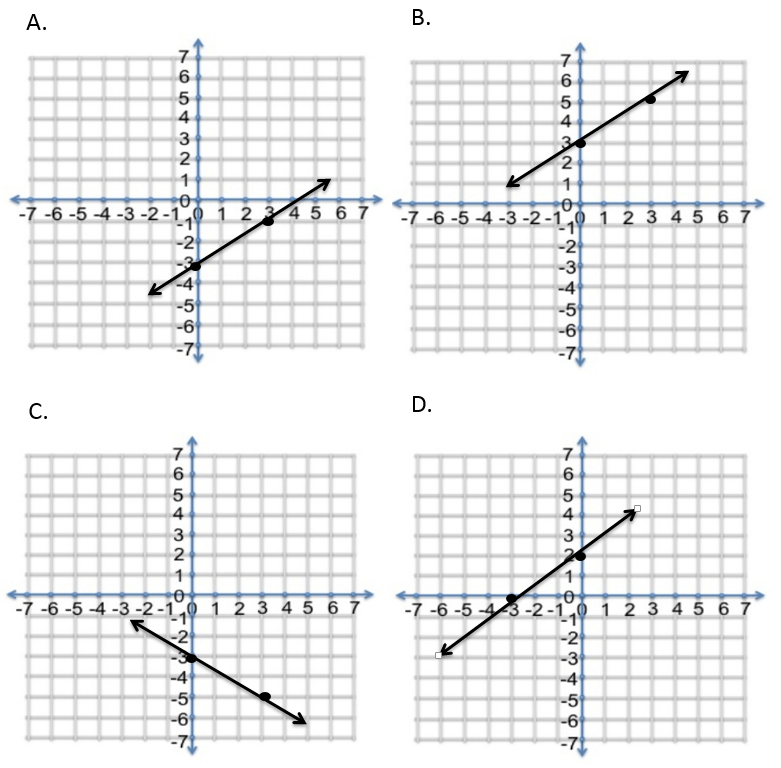
Slope-Intercept Form?
(y = mx +b)

Slope-Intercept Form?
(y = mx +b)


Slope-Intercept Form?
(y = mx +b)

Slope-Intercept Form?
(y = mx +b)
Which graph represents the equation y=4x−1 ?
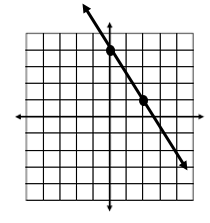
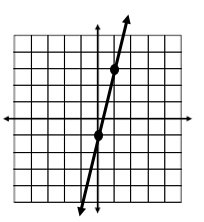
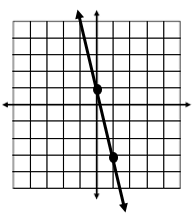
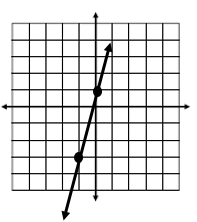


Which graph represents y=−23x+4



