
NEW
Font size
S
M
L
XL
 Worksheets
Supply and Demand Economics
Total questions: 28
Worksheet time: 19mins
Name
Class
Date
1.
This part of the market determines DEMAND
a)
buyers
b)
sellers
c)
suppliers
d)
store owners
2.
This part of the market determines SUPPLY
a)
buyers
b)
sellers
c)
consumers
d)
us
3.
For the law of demand, as price rises, what happens to quantity demanded?
a)
it goes up
b)
it goes down
c)
it stays the same
d)
it is not effected
4.
When quantity supplied and quantity demanded is equal
a)
surplus
b)
shortage
c)
equilibrium
d)
law of demand
5.
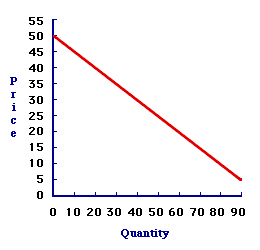
What does this curve represent?
a)
supply
b)
equilibrium
c)
demand
d)
surplus
6.
Thousands of people leave a small town due to a factory closing down. Sales at the local grocery store become slow. What causes this change?
a)
Prices or availability of substitutes
b)
Prices or availability of complementary goods
c)
Change in the weather or season
d)
Change in the number of buyers
7.
Goods that are bought and used together are
a)
complementary goods
b)
substitute goods
c)
income goods
d)
unrelated goods
8.
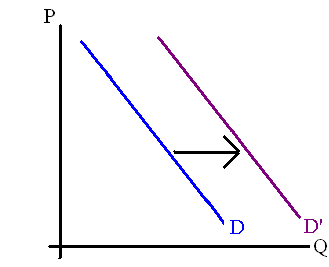
The diagram represents a
a)
increase in demand
b)
decrease in demand
c)
change in quantity demand
d)
none of the above
9.
Which of the following is likely to increase the demand for peanut butter?
a)
Fewer children in the population
b)
News that insects have destroyed much of the peanut crop and that there will be less peanut butter on the shelves in three months.
c)
A big increase in the price of jelly.
d)
A report from the Surgeon General of the United States that eating peanut butter makes people nutty.
10.
Which statement expresses a central idea of how the laws of supply and demand work?
a)
The government sets the prices for goods and services.
b)
Prices are determined by the interaction of producers and consumers.
c)
Consumers alone determine the prices for goods and services.
d)
Technology dictates the prices charged for goods and services.
11.
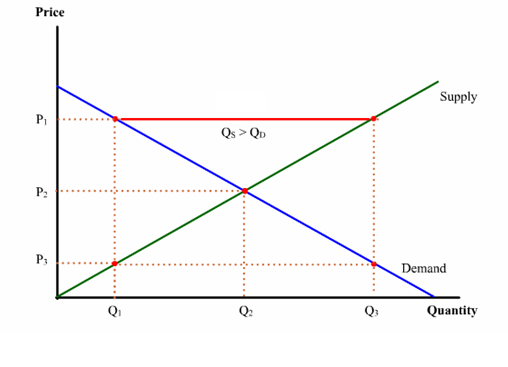
What does this graph show?
a)
Shortage
b)
Surplus
c)
Supply Table
d)
Equilibrium
12.
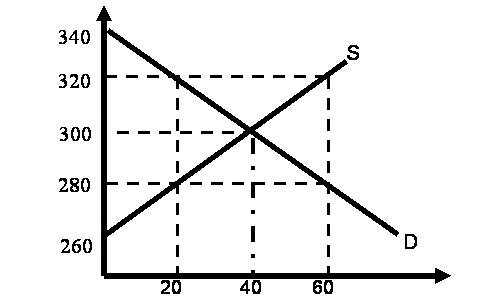
If a price floor was set at 320, what quantity would be purchased?
a)
20
b)
40
c)
60
d)
80
13.
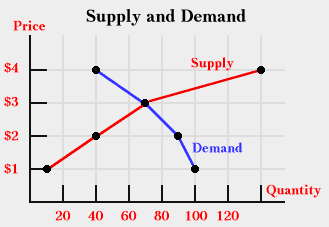
What is the Equilibrium Price?
a)
1
b)
2
c)
3
d)
4
14.

Which of the following will cause an increase in demand for snowboards?
a)
More costly production methods
b)
A decrease in the price of lift tickets at resorts in Colorado
c)
A decrease in consumer income
d)
A decrease in the population
15.
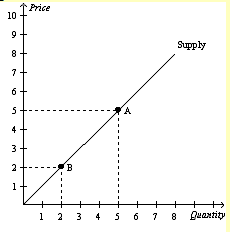
The movement from Point A to Point B represents a(n)
a)
increase in the price.
b)
decrease in the quantity supplied.
c)
shift in the supply curve.
d)
Both Orange and Blue are correct.
16.

Which of the following would not shift the supply curve for iphones?
a)
an increase in the price of iphones
b)
a decrease in the number of sellers of iphone
c)
an increase in the price of plastic, an input into the production of iphones
d)
an improvement in the technology used to produce iphones
17.
Point at which supply and demand come together
a)
price ceiling
b)
excess demand
c)
equilibrium
d)
disequilibrium
18.
Legal maximum that can be charged for a good.
a)
price ceiling
b)
excess demand
c)
equilibrium
d)
disequilibrium
19.
When the government sets a price floor on earned income, it is called which of the following?
a)
market equilibrium rate
b)
base-level wage
c)
minimum wage
d)
employment guarantee
20.
When quantity supplied exceeds quantity demanded at a certain price.
a)
shortage
b)
fad
c)
search costs
d)
surplus
21.
When quantity demanded exceeds quantity supplied at a certain cost
a)
shortage
b)
fad
c)
search costs
d)
surplus
22.

At which quantity does supply and demand reach equilibrium?
a)
500
b)
600
c)
700
d)
800
23.
At which price is equilibrium?
a)
$1.00
b)
$1.25
c)
$1.50
d)
$1.75
24.

An observer of the graph would call this a(n):
a)
Shortage
b)
Surplus
c)
Equilibrium price
d)
Demand equals supply
25.
At this price:
a)
Low prices encourage buyers but discourage sellers
b)
High prices encourage sellers but discourage buyers
c)
The market is stable
d)
Buyers can find goods at equilibrium price
26.

An observer of this graph would call this a(n):
a)
Surplus
b)
Shortage
c)
Qd = Qs
d)
Shift in supply
27.
Which description best describes the information in this graph at this price?
a)
Supply exceeds demand
b)
Demand exceeds supply
c)
Qd = Qs
d)
Qs = Qd
28.

At equilibrium price:
a)
Quantity supplied = quantity demanded
b)
Price increases to soak up excess demand
c)
Price decreases to soak up excess supply
d)
Demand increases in response to the price of related goods
Reset

