
 Worksheets
Spring 9 Weeks Test
Total questions: 43
Worksheet time: 22mins
fossil fuel energy
nuclear energy
hydroelectric energy
wind energy
astronomy
climatology
meteorology
hydrology
They can all be measured with scientific instruments.
They all have different units of measurement.
They all are part of weather models.
All of the above statements are true.
barometer
hydrometer
seismometer
anemometer
percent
grams
millimeters
pascals
dry air; moist air
high pressure; low pressure
low pressure; high pressure
moist air; dry air
the Coriolis effect
friction
temperature differences
the pressure gradient
Winds circulate around it in the clockwise direction.
it is the location of a high-pressure area.
Winds tend to flow away from it.
Winds circulate around it in the counterclockwise direction.
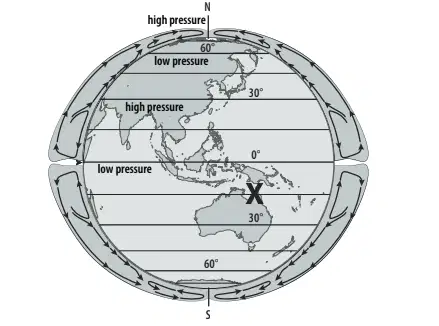
polar easterlies
doldrums
northeasterlies
trade winds
land absorbing the sun’s energy more rapidly than water does.
ocean currents warming the seashore.
water absorbing the sun’s energy more rapidly than land does.
warm land currents blowing seaward.
trade wind
cyclone
local wind
prevailing westerly
smoke nuclei
condensation nuclei
freezing nuclei
fog nuclei
alto-
cirro-
meso-
strato-
high up within the rain cloud
just below the rain cloud
as the raindrop falls between the cloud and the ground
when the raindrop hits a solid object
sublimation
deposition
condensation
freezing
The air masses mix.
Precipitation and storms form.
A front forms.
Both B and C happen.
in convective zones
from the jet stream
in their source regions
at fronts
cold
occluded
stationary
warm
cold
occluded
stationary
warm
orographic lifting
convection
frontal wedging
convergence
convection
convergence
frontal wedging
orographic lifting
hurricanes
supercells
funnels
cyclones
out in the spiral arms.
in the rain bands.
in the eyewall.
within the eye.
jet stream
pressure systems
trade winds
all of these
to drive inland an hour before it is expected to hit.
to ride out the storm.
to drive inland six hours before it is expected to hit.
to drive to an area to the left of the storm’s expected track.
the fraction of the circle that is colored in
the number to the upper left of the circle
the position of the staff
the number of flags on the staff
500 mb Height Contours Map
Surface Weather Map
Highest and Lowest Temperature Map
Precipitation Area and Amounts Map
the weekend forecast during the Thursday evening news
the 6–10-day forecast outlook
the 8–14-day outlook
the 30-day outlook

