

Wayground logo

Free Printable Worksheets

Font size

S
M
L
XL
Worksheets

Sheltered Biology Final Exam

Total questions: 20

Worksheet time: 20mins

Name
Class
Date
1.

Which of following formulas would you use to calculate population growth? (B=births, I=immigration, D=deaths, & E=emigration)

a)
(B + I) - (D + E)
b)
(B + E) - (D + I)
c)
(B + I) x (D + E)
d)
(B + I) / (D + E)
2.

What aspect of a population is the number of individuals per unit area?
a)
population growth
b)
population density
c)
population change
d)
logistic growth
3.

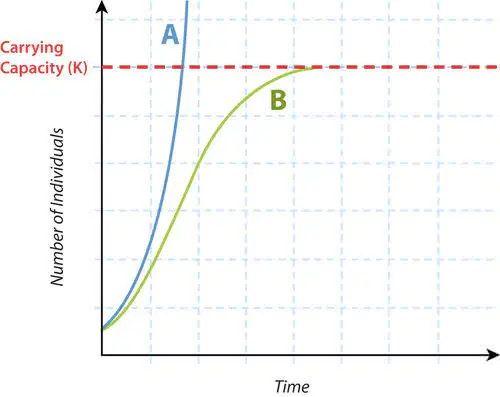
The line labeled A represents

a)
carrying capacity
b)
logistic growth
c)
exponential growth
d)
population density
4.

The line labeled B represents

a)
carrying capacity
b)
logistic growth
c)
exponential growth
d)
population density
5.

The term for the maximum number of individuals that an ecosystem can support is

a)
carrying capacity
b)
logistic growth
c)
exponential growth
d)
population density
6.

Which of the following is NOT a density-dependent limiting factor?

a)
predation
b)
disease
c)
parasites
d)
natural disaster
7.

Demographic transition refers to a shift from high birthrates and high death rates to

a)
exponential growth
b)
low birthrates and low death rates
c)
low birthrates and high death rates
d)
indefinite growth
8.

Biodiversity is important to human society because it

a)
is a natural resource
b)
provides food and goods
c)
provides medicines
d)
All of the above
9.

An ecological "hot spot" is an area where

a)
habitats and species are healthy
b)
hunting is encouraged
c)
habitats and species are in the most danger of extinction
d)
species diversity is high
10.

An increase in Earth's average temperature from the build-up of carbon dioxide and other gases in the atmosphere is called

a)
the greenhouse effect
b)
ozone depletion
c)
climate change (global warming)
d)
solar reflection
11.

A graphic representation of a human population that is broken into cohorts, usually groups of five years, is called a(n)

a)
population graph
b)
age structure diagram
c)
cohort chart
d)
population chart
12.

The statistical study of human populations is called

a)
immigration
b)
logistics
c)
demography
d)
emigration
13.

The build-up of a chemical as moves up trophic levels, and causes harm to top predators is called

a)
biological magnification
b)
ozone layer depletion
c)
climate change
d)
extinction
14.

The rapid increase in greenhouse gases over the last century has led to which threat to biodiversity?

a)
biological magnification
b)
ozone layer depletion
c)
climate change
d)
extinction
15.

What is the estimated carrying capacity of this population according to the graph?

a)
0
b)
1000
c)
2000
d)
Cannot be determined from this graph
16.

Why are invasive species a threat to indigenous populations and to overall biodiversity?

a)
invasive species are not a threat to biodiversity
b)
they have no, or fewer, predators and therefore they can grow more quickly
c)
they are stronger
d)
they have better genes
17.

Which of the following is NOT an invasive species in the United States of America?

a)
kudzu vine
b)
zebra mussels
c)
Japanese beetles
d)
white-tailed deer
18.

What is another name for the geographical distribution of a species?

a)
immigration
b)
range
c)
population density
d)
emigration
19.

The graph below featuring snowshoe hares and lynx is an example of

a)
a density-independent factor
b)
exponential growth
c)
a predator-prey relationship
d)
an age-structure diagram
20.

In which of the following does deforestation lead to a biodiversity threat

a)
plants remove carbon dioxide (a greenhouse gas) from the atmosphere
b)
soils are usually very poor and cannot sustain crops for more than one year
c)
forests are usually replaced with livestock which release methane gas (a greenhouse gas)
d)
All of the above