
 Worksheets
Prob/Stats - Final Exam Review - In Class
Total questions: 136
Worksheet time: 5hrs 32mins
Identify the population and sample.
A survey of 1535 American households found that 18% of households do not own a computer.
Population: 1535 American households
Sample: 18% of households
Population: All American households
Sample: 1535 American households
Population: All American households
Sample: 18% of households
Population: 1535 American households
Sample: 276 households
Identify the population and the sample.
A recent survey of 2625 elementary school children found that 28% of the children could be classified as obese.
Population: All elementary school children
Sample: 2625 elementary school children surveyed
Population: All elementary school children
Sample: 28% of the children
Population: 2625 elementary school children
Sample: 28% of the children
Population: 2625 elementary school children
Sample: 735 elementary school children
Researchers were interested to know whether internal vehicle temperatures vary by outside temperatures. To evaluate this, temperature rise was measured continuously over a 60-minute period in a dark SUV on 16 different clear, sunny days with outside temperatures ranging from 72oF to 96oF. The researchers' method of analysis is best described as:
a census.
a survey.
an observational study.
a randomized comparative experiment.
a single-blind randomized comparative experiment.
In the previous problem, supposed that the researchers suspected that women over the age of 55 may respond differently to the treatment. Given that a random sample of 40,000 women over the age of 45 has already been chosen, the study would have been improved by:
a stratified sample, with strata determined by age.
a stratified sample, with strata determined by gender.
a block design, with blocks determined by age.
a block design, with blocks determined by gender.
a double-blind completely randomized design.
An in-person survey in which respondents were asked if they voted in the most recent election is likely to suffer from (a) bias if the respondents feel embarrassed about no voting.
During a school project, Jackson, Abigail, and Aiden conducted a census of the students in their school. Which term is used to describe the summary values they obtained from this census?
Statistics
Parameters
Means
Centers
None of the above

Is the information collected during the survey quantitative or categorical data?
Quantitative data. I know this because the y-axis is labeled with numbers.
Quantitative data. I know this because the surveyor counted how many people that they surveyed.

If your teacher asked you to make categorical observations about the class’s pet hamster, which group of words might be used?
A mass of 3 kg, 11 cm long, age of 16 months
A mass of 3 kg, 11 cm long, cute
A long hair, white and brown colored, soft
A temperature, length, weight

Which sport represents the mode?
Soccer
Softball
Football
Basketball

What is the total number of students speaking different languages?
(a)


The table shows the results of a survey about favorite types of stores. Determine the relative frequency for each store.
clothing: 38%
electronics: 22%
pet: 10%
candy: 30%
clothing: 19%
electronics: 11%
pet: 5%
candy: 15%
clothing: 50%
electronics: 25%
pet: 5%
candy: 20%
clothing: 35%
electronics: 23%
pet: 15%
candy: 27%


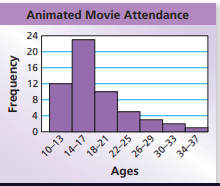
What is the shape of the data?
symmetrical
skewed left
skewed right
bell curve

What is shape of the data?
symmetrical
skewed left
skewed right
bell curve

What is the shape of the data?
symmetrical
skewed left
skewed right
bell curve

Which statement best describes this graph?
The graph is symmetrical.
There is a cluster of data between 23 and 25.
The spread is 10.
The most students sold 25 magazines.

Which statement best describes the graph?
The data is skewed left.
The data is symmetrical.
There is a peak between 10 and 14 hours.
There is a cluster between 5 and 9
What measure of center (mean, median ) would be best for the following set of data?
0, 89, 92, 97, 99, 100
Median, because it is the one that shows up the most.
Median, because there is an outlier.
Mean, because there is not an outlier.
There is not a best measure of center for this data.

Find the median of the data set
(a)

Which dot plot has the greatest variability (spread)?
The data set below has an outlier of 42.
2, 5, 12, 15, 19, 4, 6, 11, 16, 18, 12, 12, 42
What effect does the outlier have on the distribution of the data?
Find the median of this set of numbers:
10, 10, 7, 12, 11
(a)

How many veterans had more than 15 years of service?
(a)

What is the IQR of this data set?
9, 5, 6, 3, 1, 8
(a)
Roger bowled 7 games last weekend. His scores are: 155, 165, 138, 172, 127, 193, 142. What is Roger's median score?
(a)

What is the IQR of the Cruisers?
(a)
What is the median (Q2) of the data set:
3, 5, 2, 1, 4, 5, 8
(a)
What is the Q1 (median of lower half) of the data set: 3,5,2,1,4,5,8
(a)

What is the difference in the IQRs?
(a)


What percentage of students scored a 39 or higher?
None
25%
50%
75%
The middle 50% of scores were between....
30-39
30-50
39-55
50-68

Which group has a higher median reaction time?
Group A
Group B
They're the same
The mean number of accidents a week at a company is 6.4 with a standard deviation of 1.5. What is the probability that in a week there would be fewer (less) than 5 accidents?
0.6915
0.1762
0.8238
-0.93
About what percent of the products last between 12 and 15 days?

On the math portion of the SAT, scores are roughly normal, with a mean of 500 and a standard deviation of 100. What percent of scores are above 400?
68%
81.5%
84%
99.7%

On the math portion of the SAT the scores are roughly normal with a mean of 500 and a standard deviation of 100. Between what two values do approximately 95% of scores lie?
500-600
200-800
300-700
500-800
The mean baking time of an angel food cake is 41 minutes with a standard deviation of 5 minutes (normally distributed). What percent of angel food cakes take less than half an hour to bake?
98.61%
2.2%
1.39%
97.8%
Following a normal distribution the mean wingspan of a hummingbird is 3.5 mm with a standard deviation of 0.76 mm. What percentage of hummingbirds have wingspans between 3.4 and 4.1 mm?
33.7%
43.72%
40.1%
67.5%
Mensa International is a non-profit organization that accepts only people with IQ score within the top 2%. What level of IQ qualifies one to be a member of Mensa?
115
130.75
145
120.5
At a college the scores on the chemistry final exam are approximately normally distributed, with a mean of 75 and a standard deviation of 12. The scores on the calculus final are also approximately normally distributed, with a mean of 80 and a standard deviation of 8. A student scored 81 on the chemistry final and 84 on the calculus final. Relative to the students in each respective class, in which subject did this student do better?
The student did better in chemistry.
The student did better in calculus.
The student did equally well in each course
There is no basis for comparison, since the subjects are different from each other .
There is not enough information for comparison, because the number of students is not known.

The weight of adult male grizzly bears living in the continental US is approximately normally distributed with a mean of 500 pounds and a standard deviation of 50 pounds. The weight of adult female grizzly bears is approximately normally distributed with a mean of 300 pounds and a standard deviation of 40 pounds. Approximately, what would be the weight of a female grizzly bear with the same standardized score (z-score) as a male grizzly bear with a weight of 530 pounds?
276 pounds
324 pounds
330 pounds
342 pounds
533 pounds

For a recent season in college football, the total number of rushing yards for that season is recorded for each running back. The mean number of rushing yards for the running backs that season is 790 yards. One running back had 1,637 rushing yards for the season, which is 2.42 standard deviations above the mean number of rushing yards. What is the standard deviation of the number of rushing yards for the running backs that season?
250 yards
300 yards
350 yards
400 yards
450 yards

A researcher is studying a group of field mice. The distribution of the weight of field mice is approximately normal with mean 25 grams and standard deviation 4 grams. Which of the following is closest to the proportion of field mice with a weight greater than 33 grams?
0.023
0.046
0.954
0.977
1.000

Mean of sample proportions
A statistic is an unbiased estimator of a parameter when
in many samples, the values of the statistic are centered at the parameter
the statistic is calculated from a random sample.
in a single sample, the value of the statistic is equal to the parameter
The Gallup Poll asked a random sample of 1785 adults whether they attended church during the past week. Let p-hat be the proportion of people in the sample who attended church. A newspaper report claims that 40% of all U.S. adults went to church last week. Suppose this claim is true.
What is the mean of the sampling distribution?
n
sample size
P
population %
μ
population avg.
σ
standard deviation
28% of all Woodrow students believe Monday will be snow day. You take a sample of 50 students and find that 15 of them believe Monday will be a snow day. What does 28% represent?
n
sample size
P
population %
μ
population avg.
σ
standard deviation
What happens to the shape of a sampling distribution as n(sample size) increases?
It becomes wider
It becomes more narrow
It becomes skewed
64% of all RCHS students believe sunglasses can be worn in class. You take a sample of 56 students and find that 35 of them believe sunglasses can be worn in class. What does 56 represent?
n
P
μ
σ
The Gallup Poll asked a random sample of 240 adults if they had a speeding violation. 96 said they did. Let p-hat be the proportion of people in the sample who had speeding tickets. The local police department reports that 42% of the citizens had speeding tickets. Suppose this claim is true. What is the mean of the sampling distribution?
0.4
0.42
0.58
0.6
What happens to the shape of a sampling distribution as n (sample size) decreases?
It becomes narrower
It becomes skewed.
It becomes wider

mean of sample proportion
standard deviation
Explain the Central Limit Theorem and its significance in statistics.
The Central Limit Theorem states that the sampling distribution of the sample mean will be approximately exponentially distributed, regardless of the shape of the population distribution. It is significant in statistics because it allows us to make inferences about the population standard deviation using the sample standard deviation.
The Central Limit Theorem states that the sampling distribution of the sample mean will be approximately skewed distributed, regardless of the shape of the population distribution. It is significant in statistics because it allows us to make inferences about the population mode using the sample mode.
The Central Limit Theorem states that the sampling distribution of the sample mean will be approximately normally distributed, regardless of the shape of the population distribution. It is significant in statistics because it allows us to make inferences about the population mean using the sample mean.
The Central Limit Theorem states that the sampling distribution of the sample mean will be approximately uniformly distributed, regardless of the shape of the population distribution. It is significant in statistics because it allows us to make inferences about the population median using the sample median.
What is a sampling distribution and how is it different from a population distribution?
A sampling distribution is the distribution of a sample mean, whereas a population distribution is the distribution of a sample range.
A sampling distribution is the distribution of a sample statistic, such as the mean or standard deviation, whereas a population distribution is the distribution of the entire population.
A sampling distribution is the distribution of a population, whereas a population distribution is the distribution of a sample.
A sampling distribution is the distribution of a sample size, whereas a population distribution is the distribution of a population size.
If the population mean is 50 and the standard deviation is 10, what is the mean of the sampling distribution if the sample size is 100?
75
25
50
100
Explain the concept of the mean of a sampling distribution and its relationship to the population mean.
The mean of a sampling distribution is an estimate of the population mean.
The mean of a sampling distribution has no relationship to the population mean.
The mean of a sampling distribution is not an estimate of the population mean.
The mean of a sampling distribution is always higher than the population mean.
If a population is normally distributed with a mean of 60 and a standard deviation of 5, what can we say about the shape of the sampling distribution of the sample mean for a sample size of 30?
Uniformly distributed
Negatively skewed
Positively skewed
Normally distributed
The Gallup Poll asked a random sample of 1785 adults whether they attended church during the past week. Let p-hat be the proportion of people in the sample who attended church. A newspaper report claims that 40% of all U.S. adults went to church last week. Suppose this claim is true.
What is the mean of the sampling distribution of p-hat?
0.40
0.44
0.56
0.60
What is the standard deviation of the sampling distribution?
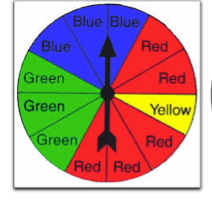

There are 20 marbles in the jar.
What is the probability of choosing a marble that is NOT green from the jar?
CHECK ALL THAT APPLY
10/20
5%
10%
0.5

In a survey, 100 middle school students were asked which social media platform they preferred. The results are shown in the table above.
What is the probability that a student prefers TikTok?
CHECK ALL THAT APPLY
72 out of 100
72%
0.72
72/100


A regular 6-sided die is to be rolled once. What is the probability that a number less than 3 is rolled?
1/3
1/6
1/2
2/3


You have a jar with 24 pieces of chocolate candy and 14 pieces of orange candy. We take one piece of candy at random from the jar, put it back, and then take a second piece of candy at random from the jar.
Is the event INDEPENDENT or DEPENDENT?
Amy plays card games. She picks a card at random. Then without putting the first card back, she picks a second card at random.
Independent
Dependent
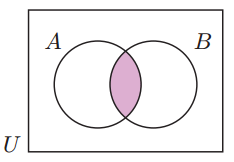
If A = {1, 3, 5, 7, 9} and B = {2, 3, 5, 7}, what is A ∩ B?
{3, 5, 7}
{2, 3, 5, 7}
{2, 3, 5, 7, 9}
{1, 2, 3, 5, 7, 9}


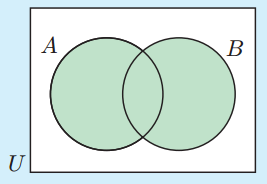
If A = {1, 3, 5, 7, 9} and B = {2, 3, 5, 7}, what is A ∪ B?
{3, 5, 7}
{2, 3, 5, 7}
{2, 3, 5, 7, 9}
{1, 2, 3, 5, 7, 9}
What does this symbol ( ∪ ) represent in set theory?
Union
Intersection
Disjointed
Subset


Consider the following table with information about all of the students taking Statistics at Happy High School.
P( Male | Full-time)
28/71
3/7
12/71
3/10


What is the probability the dessert has peanut butter in it?
0.84
0.58
0.22
0.59

What is the chance that the dessert is brownies and has peanut butter in it?
0.94
0.58
0.99
0.95

What is the chance that the dessert is not brownies and does not have peanut butter in it?
0.58
0.42
0.06
0.05

What is the probability that the dessert is brownies or does have peanut butter in it?
0.95
0.99
0.42
0.64

Knowing that the dessert has peanut butter in it, what is the probability that it's brownies?
1.58
0.58
0.02
0.98

P (brownies l no peanut butter)
0.12
0.88
0.05
0.58


The results of a linear regression are shown.
Which phrase best describes the relationship between x and y?
strong negative correlation
strong positive correlation
weak negative correlation
weak positive correlation
If the line of regression is y = 3.45x - 6.7 and the actual point is (5,12), what is the residual for that point?
1.45
-1.45
34.7
-34.7

y= 40x+100, where x is number of weeks and y is weight in grams.
What does the y-intercept mean in context of the problem?
The correlation coefficient, r is used to determine
y values given values of x.
x values given values of y.
the strength and direction of relationship between x and y.
none of these.

