
 Worksheets
Traffic Flow Theory Quiz
Total questions: 40
Worksheet time: 3hrs 20mins
In a 2-lane (one-way) arterial road 10 minute flow is 540 vehicles, the maximum design service volume is 2400 vehicles and the number of vehicles passing in a day is 50,000 vehicles what will be the rate of flow and PHF?
2400 and 1.73
2400 and 0.74
3240 and 0.74
3240 and 1.73
The following minutes of flow rates were observed for the peak hour on an expressway section. Determines the 10min PHF.
0.67
0.65
0.69
0.80

From the above data calculate the maximum rate of flow
189
175
228
163
In a 5km road 70 vehicles are moving. Among them 25 vehicles are moving at a speed of 45kmph, 5vehicles are moving 56kmph, 30vehicles are moving 48kmph and 10 vehicles are moving at a speed of 52kmph. What will be the time mean speed of that length.
46
45
52
48
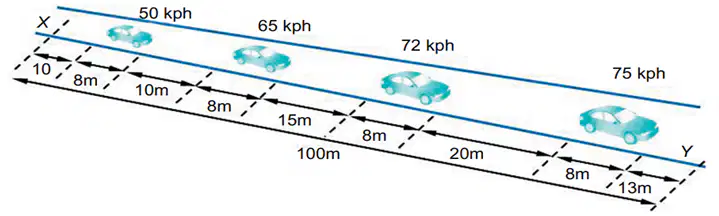
In a highway segment XY, an observer standing at location X counted four vehicles passing in front of him in 20sec. their speeds are labelled in the below figure. Find the time-mean speed.
65.50
58.80
67.67
60.96
In a one-way road, initially the was 1000 veh per hour and density was 16 veh per km, after sometime a heavy vehicle of speed 16kmph entered on that stretch of road so that the density decreased to 75 veh per km. What will be the speed of generated shock wave?
-3.39kmph
3.39kmph
0.29kmph
-0.29kmph
What is forward forming shockwave?
Moving towards upstream and forming congestion
Moving toward downstream and forming congestion
Moving towards upstream and recovery from congestion
Moving towards downstream and recovery from congestion
The southbound approach of a signalized intersection carries a flow of 1000 veh/h/ln at a velocity of 50 km/h. The duration of the red signal indication for this approach is 15 sec. If the saturation flow is 2000 veh/h/ln with a density of 75 veh/ln, the jam density is 150 veh/km, determine the length of the queue at the end of the red phase
30.12m
28.95m
32.10m
28.50m
The southbound approach of a signalized intersection carries a flow of 1000 veh/h/ln at a velocity of 50 km/h. The duration of the red signal indication for this approach is 15 sec. If the saturation flow is 2000 veh/h/ln with a density of 75 veh/ln, the jam density is 150 veh/km, determine the length of the queue at the end of the red phase ---- When the signal turned red in above example, what is the type of shockwave?
Forward Forming Shockwave
Backward Forming Shockwave
Backward Recovery Shockwave
Forward Recovery Shockwave
The southbound approach of a signalized intersection carries a flow of 1000 veh/h/ln at a velocity of 50 km/h. The duration of the red signal indication for this approach is 15 sec. If the saturation flow is 2000 veh/h/ln with a density of 75 veh/ln, the jam density is 150 veh/km, determine the length of the queue at the end of the red phase ---- From the above data what will be the speed of backward recovery shockwave in m/sec?
7.41
-7.41
2.14
-2.14
The southbound approach of a signalized intersection carries a flow of 1000 veh/h/ln at a velocity of 50 km/h. The duration of the red signal indication for this approach is 15 sec. If the saturation flow is 2000 veh/h/ln with a density of 75 veh/ln, the jam density is 150 veh/km, determine the length of the queue at the end of the red phase --- When the signal turned green in above example, what is the type of shockwave?
Forward Forming Shockwave
Backward Forming Shockwave
Backward Recovery Shockwave
Forward Recovery Shockwave
The southbound approach of a signalized intersection carries a flow of 1000 veh/h/ln at a velocity of 50 km/h. The duration of the red signal indication for this approach is 15 sec. If the saturation flow is 2000 veh/h/ln with a density of 75 veh/ln, the jam density is 150 veh/km, determine the length of the queue at the end of the red phase --- Determine speed of backward forming shockwave in m/sec?
7.41
-7.41
2.14
-2.14
The southbound approach of a signalized intersection carries a flow of 1000 veh/h/ln at a velocity of 50 km/h. The duration of the red signal indication for this approach is 15 sec. If the saturation flow is 2000 veh/h/ln with a density of 75 veh/ln, the jam density is 150 veh/km, determine the length of the queue at the end of the red phase --- What will be the maximum queue length?
47.8m
46.50m
45.13m
44.76m
Which type of shockwave is formed when two streams having different flow values but same density meets?
Stationary
Backward Forming
Forward Propagating
Backward Recovery

Find the space mean speed from the set of speed data given in table.
39.533
39.347
38.567
37.347

Using below data calculate the flow, if the space headway is 50m?
750
787
380
760

The speed-density relationship of traffic on a freeway lane is given below. What is the capacity?
1001
220.08
1473
736.4

From equation 1, determine the density of the traffic stream.
220
18.2
9.1
80.93

From equation 1, determine the speed of the traffic stream?
220
18.2
9.1
80.93
The capacity of a road section is 1503 veh/hour and the jam density is 60 veh/km. Develop the speed-density relationship for this road section using the Greenshield model.
u = 25.05-0.417k
u = 100.2-0.598k
u = 25.05-2.39k
u = 100.2-1.67k
Which among the following is a drawback of the Greenberg model?
Can't predict the speed at lower densities
Can't predict the speed at higher densities
Jam density is infinite
Speed never reaches zero
Which among the following is not affecting the D factor?
Development density
Radial routes
Speed
None of the above
In Eddie's two-regime model, ______ model is used in free flow conditions, and ______ model is used in congested conditions.
Underwood and Greenberg
Greenshield and Greenberg
Underwood and Northwestern
Greenberg and Underwood
In the Greenshields model of macroscopic traffic flow, which of the following assumptions is true?
Free flow speed is infinite
Non-linear speed-density relationship
Jam density is infinite
Linear speed-density relationship
What is the maximum flow as per the Greenberg equation, if the optimum speed is 56veh/hr, and jam density is 185 veh/km?
2263
3811
2590
2811
Which among the following factors doesn't affect the PCU?
Size of the vehicle
Land-use pattern
Number of people in the vehicle
Width of the road

Traffic count data taken from detector on a freeway is shown below. Determine AADT
6844
7903
6544
6244

On a 1000 feet segment on an arterial the following travel times were measured for individual vehicles. Determine the SMS.
47.22
47.11
48.22
48.11
What does a Peak Hour Factor (PHF) of 1.0 imply in real-world traffic flow?
A. Peak congestion during a short burst
B. Uniform flow across all 15-min intervals within the hour
C. Total flow is higher than capacity
D. Traffic volume is zero during off-peak intervals
In a time-space diagram, if two vehicle trajectories intersect, what does it signify?
A. The vehicles overtook each other with adequate spacing
B. The vehicles are driving in parallel lanes
C. The vehicles were at the same position at the same time
D. Nothing significant; trajectories often intersect
Which of the following best explains why the D-factor tends to decrease with increasing development density?
A. Denser areas always have higher vehicle ownership
B. Travel demand in dense areas is more evenly bi-directional
C. Dense areas concentrate travel in one direction
D. D-factor is unrelated to urban density
According to Greenshields' model, what happens to flow (Q) when density increases from zero to jam density?
A. It increases linearly with density
B. It increases up to a point and then decreases
C. It remains constant
D. It decreases linearly with density
Which of the following is not a reason why PCU values should be dynamic rather than fixed in Indian conditions?
A. Varying vehicle sizes
B. Differences in driver behavior
C. Weather conditions
D. Uniform road conditions across India
What distinguishes Underwood's model from Greenshields' in terms of speed-density relationships?
A. Underwood assumes linear increase in speed with density
B. Underwood model uses a logarithmic speed-flow relationship
C. Underwood's model implies infinite jam density
D. Underwood assumes zero speed at zero density
Why is space mean speed (SMS) considered more appropriate than time mean speed (TMS) for congestion analysis?
A. SMS is easier to measure on field
B. TMS underestimates actual congestion
C. SMS accounts for the time vehicles spend in a road section
D. TMS always equals SMS
Which statement best captures the philosophy of multiregime traffic models?
A. They apply only to signalized intersections
B. They assume traffic flow is always uniform
C. They model different relationships in free, transition, and congested regimes
D. They are obsolete due to microscopic models
On a time-space diagram, what does the slope of a shockwave line represent?
A. The vehicle speed
B. The change in vehicle spacing
C. The shockwave speed
D. The acceleration rate
What does a frontal stationary shockwave typically represent?
A. Recovery from a traffic jam
B. A moving bottleneck
C. A fixed obstruction like a signal or toll booth
D. Lane changing in free flow
Suppose a new flyover is constructed in your city to ease congestion at a busy intersection. After a few months, you observe that congestion has only shifted downstream and travel times remain nearly the same. Which of the following best explains this unintended outcome using traffic flow theory principles?
A. The capacity of the flyover was underestimated during design
B. The flyover induced demand, altering upstream flow conditions and creating new bottlenecks
C. Drivers did not know how to use the flyover due to poor signage
D. The shockwave speed at the intersection was negative
Imagine two urban roads have the same capacity (maximum flow) but differ in jam density. One is a narrow road with encroachments and the other is a wider arterial with effective enforcement. How will their speed-density curves differ, and what does it imply about congestion?
A. Both roads will have identical speed-density curves since capacity is the same
B. The road with higher jam density will reach capacity at lower speeds, implying slower congested flow
C. The road with lower jam density will have higher flow throughout
D. Jam density has no impact on the shape of the speed-density curve

