Worksheets
quiz1
Total questions: 38
Worksheet time: 1hrs 11mins


The temperature outside and the number of hot chocolate sold at a football game.
The number of people that go the pool and the temperature outside.
The outside temperature and the amount of layers you wear.


What type of correlation best describes the scatterplot shown.
positive, weak
positive, strong
negative, weak
no correlation

What type of correlation best describes the scatter plot shown?
positive, weak
positive, strong
negative, weak
negative, strong

What correlation coefficient would be describe the correlation?
0
-0.999
0.978
0.2

Which correlation coefficient best describes the correlation shown?
0
-0.75
-0.3
0.3

Which type of regression model does the scatter plot appear to show?
linear
exponential
quadratic

Which type of regression model does the scatter plot appear to show?
linear
exponential
quadratic


Determine the curve of best fit. Hint: view the scatter plot and check correlation coefficients to determine which is the best fit.
y = -2.7x + 7.4
y = 0.95x2 - 2.08x - 0.75
y = -.05x - 3.26
y = 0.95x2 + 2.08x + 0.75
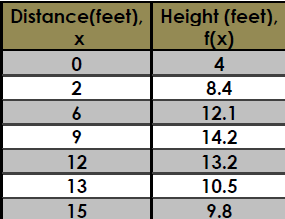
Find the quadratic equation for the relationship of the horizontal distance and the height of the ball.
y= -18x2 + 2.11x + 4.21
y= -.06x2 +1.06x + 7.9
y= -6x2 +1.06x + 79
y= -.12x2 + 2.11x + 4.22

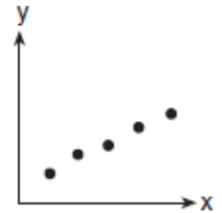
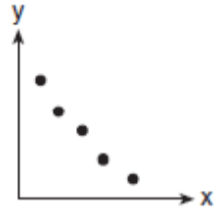
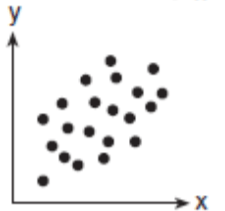
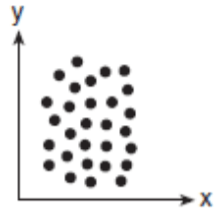
Which scatter plot diagram shows the strongest positive correlation?