wayground logo

Free Printable Worksheets

NEW

Font size

S
M
L
XL
Worksheets

Accuracy, Precision, Percent Error, and Sig Figs

Total questions: 24

Worksheet time: 32mins

Name
Class
Date
1.

A set of data are all close to each other, but they are not close to the actual value. This set of data can be described as having...

a)

good accuracy

b)

good precision

c)

both good precision and accuracy

d)

neither good precision nor good accuracy

2.

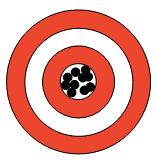
Examine the picture below and explain what it represents in terms of accuracy and precision

a)
b)

the picture on the left shows low accuracy and low precision. The picture on the right shows high precision but low accuracy

c)

the picture on the right shows low accuracy and low precision. The picture on the left shows high precision but low accuracy

d)

both circles show low precision

3.

Accuracy is

a)

Measurements that are close together

b)

Measurements that are close to the true value

c)

How close measurements are to the true value

d)

How close together measurements are to each other

4.

Students worked in teams to measure the length of an object. The actual length of the object was 7.0 cm.. Select the best choice that represents their data in terms of accuracy and precision

GROUP RESULTS

5.00 cm

5.01 cm

5.02cm

4.99 cm

5.00 cm

4.99 cm

a)

both accurate and precise

b)

only accurate

c)

only precise

d)

not accurate and not precise

5.
When a measurement is repeatable and consistent it is said to have...
a)
High precision
b)
Low precision
c)
High accuracy
d)
Low accuracy
6.
?
a)
High Accuracy & High Precision
b)
High Accuracy & Low Precision
c)
Low Accuracy & High Precision
d)
Low Accuracy & Low Precision
7.
The students measured length during a science experiement, they got 12 cm. But the actual measurement was 14.25 cm. What was the percent error?
a)
15.79%
b)
18.75%
c)
2.25%
d)
18%
8.
Jessie estimates the weight of her cat to be 8 pounds.  The actual weight of the cat was 10 pounds.  Find the percent error.  
a)
15%
b)
20%
c)
25%
d)
30%
9.

Which Student is the most Precise?

a)

Alex

b)

Shandra

c)

Luis

10.
The attendance for the basketball game was estimated to be 15,000 people but 12,500 people attended. What was the percent error?
a)
16.67%
b)
20%
c)
2500%
d)
80%
11.
How many significant figures: 216 m
a)
1
b)
2
c)
3
d)
0
12.
How many significant figures: 153.0 mL
a)
1
b)
2
c)
3
d)
4
13.
How many significant figures: 0.012 km
a)
1
b)
2
c)
3
d)
4
14.
How many sig figs are there?
100000000
a)
1
b)
9
c)
10
15.

Determine the number of Significant Figures in 10.0 grams

a)

5

b)

4

c)

3

d)

2

16.
Round 0.010229 to four sig figs
a)
1022
b)
1023
c)
0.01023
d)
0.01022
17.
What is 78.5 rounded to one significant figure?
a)
79
b)
78.5
c)
70
d)
80
18.
Round off 509.96 to 4 significant figures.
a)
509.9
b)
509.0
c)
510.0
d)
510
19.
Solve. Round using SigFig math rules.
98.7°C - 97.25°C 
a)
1°C
b)
1.4°C
c)
1.45°C
d)
1.450°C
20.
86.04 + 4.04
a)
9.044
b)
9044
c)
90.08
d)
90.44
21.
Solve & Round to Correct Sig Figs.
4.5 x 2.34 = 
a)
11
b)
10.52
c)
10.5
d)
10
22.
Solve & Round to Correct Sig Figs.
100 / 2 = 
a)
50
b)
50.
c)
50.0
d)
50.00
23.

33 g - 2.1 g = ?

a)

31.9 g

b)

31 g

c)

30.9 g

d)

30 g

24.
Calculate 12.47 m ÷ 3.2 s and give your answer with the correct number of significant figures.
a)
4 m/s
b)
3.9 m/s
c)
3.90 m/s
d)
3.897 m/s