
NEW
Font size
 Worksheets
THE GAMBIA NATIONAL AUDIT TEAM: DATA ANALYSIS, REPORT AUTOMATION
Total questions: 34
Worksheet time: 17mins

What keyboard shortcut allows you to navigate to the edge of a data table in Excel?
CTRL + Shift
CTRL + Arrow keys
ALT + Arrow keys
SHIFT + Arrow keys
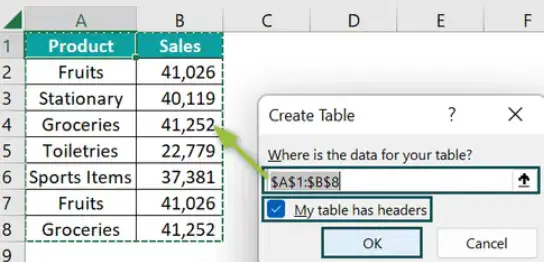
In Excel data management, what is the primary benefit of converting raw data into a dynamic Excel Table?
It allows for manual sorting only
It enables automated formulas and audit trail integrity
It restricts data entry
It removes all formatting
How can you standardize mixed upper and lower case entries in an Excel column?
Use the TRIM function
Use the PROPER, UPPER, or LOWER functions
Use the DATEVALUE function
Use the SUBSTITUTE function for commas
Which Excel function is used to remove extra spaces from cell entries?
CLEAN
TRIM
PROPER
VALUE
When developing PivotTable reports, what is the first step in formulating guiding questions?
Select chart types
Identify key metrics like sums or variances needed for analysis
Import data from CSV
Add slicers
In Power Query, what feature records steps for data transformation, allowing edits or reordering?
PivotTables
Applied Steps pane
DAX formulas
Slicers
How do you automate reporting in Excel using Power Query and PivotTables?
Manually copy data each time
Refresh the query and PivotTable to update with new data
Use SQL queries only
Delete and recreate the table
What is the main purpose of data visualization in Excel?
To store raw data
To transform mountains of data into actionable intelligence
To trim spaces
To format dates
When should you use a pie chart in Excel visualizations?
For comparing trends over time
For showing proportions of a whole, like category breakdowns
For detailed numerical comparisons
For scatter plots
Slicers in Excel are best used when?
You need to filter data interactively across multiple charts or PivotTables
You want to trim text
You are formatting numbers
You are merging cells
To make Excel charts look more professional, what principle should you follow?
Add as many colors as possible
Simplify by removing unnecessary elements like gridlines or legends
Use 3D effects always
Increase font sizes to maximum
When is a timeline filter most appropriate in an Excel report?
For categorical data like departments
For date-based data to dynamically filter by periods like months or quarters
For numeric variances only
For text trimming
In setting up an Excel dashboard, what is the goal?
To display raw data tables
To provide a unified glance at key insights with visuals, slicers, and KPIs
To import CSV files
To execute SQL queries
What is Power BI primarily used for?
Basic spreadsheet calculations
Advanced data visualization, modeling, and business intelligence
Trimming text spaces
Navigating tables with arrows
Which component of the Power BI Ecosystem is used for creating and publishing reports online?
Power BI Desktop
Power BI Service
Power BI Mobile
Excel Power Query
In Excel, how do you quickly jump to the last row of data in a column?
Use CTRL + Down Arrow
Use ALT + Enter
Use SHIFT + Space
Use CTRL + Home
For effective data management in Excel, why should you avoid merged cells?
They enhance sorting
They create analytical chaos in formulas and PivotTables
They automate reports
They format dates automatically
To handle mixed cases, which function capitalizes the first letter of each word?
UPPER
LOWER
PROPER
TRIM
Guiding questions for PivotTables might include: "What is the variance by department?" This helps in?
Creating custom calculations within the PivotTable
Trimming spaces
Navigating tables
Using SQL
In Power Query, how do you combine data from multiple sources?
Use Append or Merge Queries
Use CTRL + Arrow
Use Pie Charts
Use Timeline Filters
To refresh an automated report in Excel, you can?
Right-click the PivotTable and select Refresh after updating the Power Query source
Delete the file
Merge cells
Use UPPER function
For visualizing trends over time, which chart type is best?
Pie Chart
Bar Chart
Line Chart or Trend Line
Scatter Plot for categories
Slicers should be inserted when?
You need non-interactive filters
You want to control multiple visuals dynamically for oversight
You are trimming text
You are formatting numbers
To customize charts professionally, you should?
Add clutter like extra labels
Use consistent colors and simplify axes
Always use 3D
Ignore data labels
A timeline filter is useful for?
Static text data
Interactive date range selection in dashboards
Mixed case handling
SQL retrieval
In Power BI Desktop, you can?
Build data models and visuals locally
Only view mobile reports
Trim Excel spaces
Navigate tables with arrows
What does the "Extract" step in the ETL process involve?
Cleaning and standardizing data formats
Retrieving raw data from various sources like databases or files
Building visual reports for sharing
Creating data models with relationships
In the data process, why is data cleaning important before analysis?
It increases file size for better storage
It ensures accuracy, consistency, and reliability to prevent errors in insights
It automates all reporting without human intervention
It only affects visual chart colors
Why is it necessary to conduct data transformation before building reports for insights consumption?
To make data incompatible with tools like PivotTables
To standardize formats, remove inconsistencies and enable accurate summaries & visualization
To delete all original data sources
To restrict access to reports
In the core data process, what does "Share" typically involve after Reports?
Deleting the analyzed data
Distributing insights through dashboards, PDFs, or collaborative platforms like Power BI Service
Merging cells in Excel
Navigating tables with keyboard shortcuts
What is the purpose of the "Model" step in the data process?
Sharing reports via email
Creating structured relationships and calculations (e.g., using DAX in Power BI) for efficient querying
Extracting data from websites
Trimming extra spaces only
What is a key importance of automating the data process for reporting audit data in a national audit office?
It encourages manual data entry to build team skills
It reduces turnaround time, minimizes errors, and ensures consistent, refreshable insights for oversight
It complicates workflows to increase job security
It limits data access to prevent automation adoption
What is a basic SQL command to retrieve all data from a table named "Audits"?
SELECT * FROM Audits;
INSERT INTO Audits;
UPDATE Audits;
DELETE FROM Audits;
In SQL, to filter data where Compliance Score > 80 from "Audits" table?
SELECT * FROM Audits WHERE Compliance Score > 80;
INSERT INTO Audits VALUES (80);
UPDATE Audits SET Score = 80;
DELETE FROM Audits WHERE Score > 80;

