
 Worksheets
Climate Factors
Total questions: 20
Worksheet time: 20mins
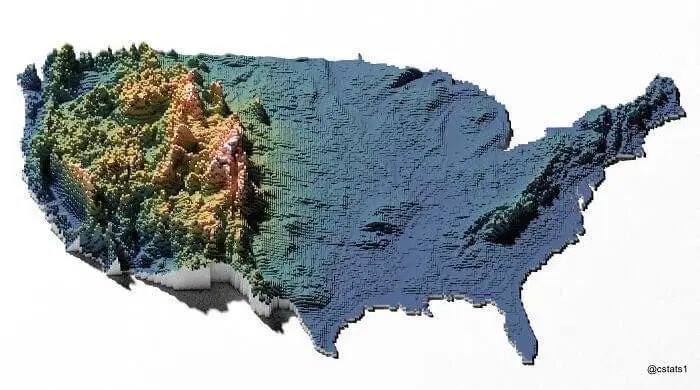
How does higher altitude affect climate?
The higher you go above sea level, the colder it gets.
Higher altitudes lead to increased humidity.
Higher altitudes result in warmer temperatures.
Higher altitudes have no effect on climate.
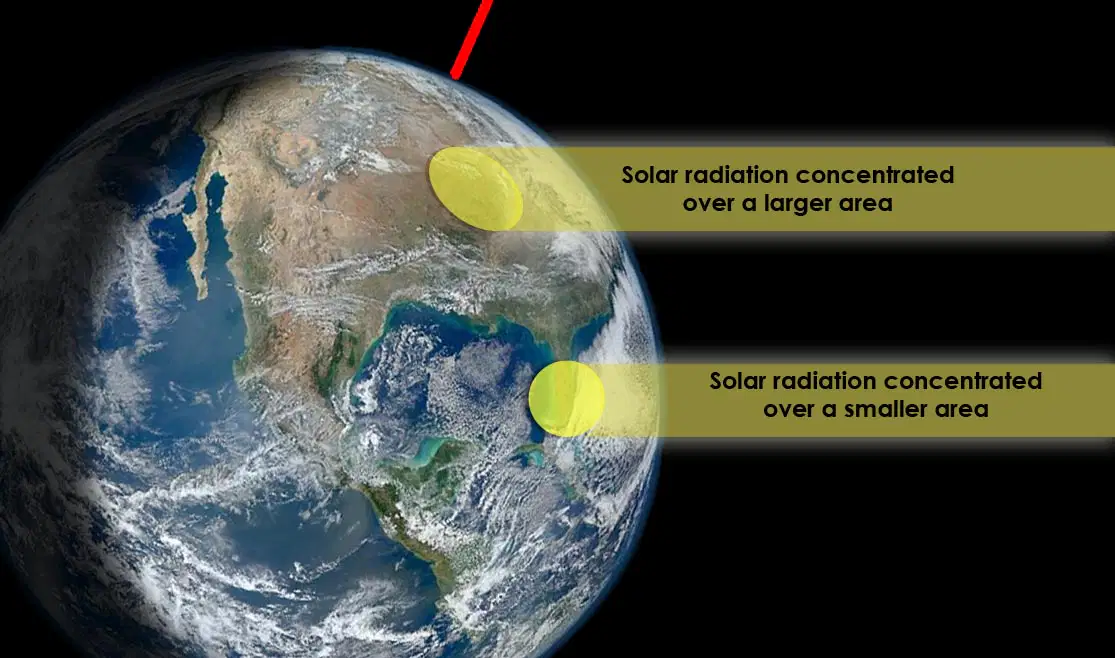
As latitude increases, the average annual surface temperature
increases.
decreases.
remains constant.
fluctuates significantly.

Which months have the warmest temperatures?
December, January, February
March, April, May
June, July, August
September, October, November

Arica has cooler temperatures than Rio de Janeiro because
Rio de Janeiro is affected by a warm ocean current.
Arica is located at a higher altitude than Rio de Janeiro.
Rio de Janeiro has more urban development than Arica.
Arica experiences more rainfall than Rio de Janeiro.

At which point in the diagram are you likely to find a hot, dry desert climate?
point W
point X
point Y
point Z

Which location would be considered windward?
Location A
Location B
Location C
Location D

The photograph below shows Mt. Kilimanjaro, a volcano in Africa, located near the equator. Which climate factor is responsible for the snow seen on Mt. Kilimanjaro?
high elevation
proximity to the ocean
tropical rainforest climate
seasonal monsoons

Which city is located closest to the Equator?
A
B
C
D
Which location would be considered leeward? Options: Location A, Location B
Location A
Location B
Location C
Location D

Grand Junction is on the windward side of the Rocky Mountain Range. The temperatures would be _____ compared to Denver.
Warmer
Cooler
Hotter
Colder

Ocean currents bring warm water from the equator towards Earth's
Equator
Tropics
Poles
Deserts

Which city has a warmer climate?
Kitunda because it is closer to the equator
Shinyanga because it is closer to the equator
Shinyanga because it is further from the equator
Kitunda because it is further from the equator

Based on these climographs, which of these cities is most likely closest to the equator? Mbandaka, Charleston, Yakutsk
Mbandaka
Charleston
Yakutsk
Nairobi
Which location would experience the largest temperature range/most EXTREME temperatures?
Location A, because it is close to the ocean
Location F, because it is in the valley
Location C, because it is near the mountains
Location D, because it is farthest from the ocean
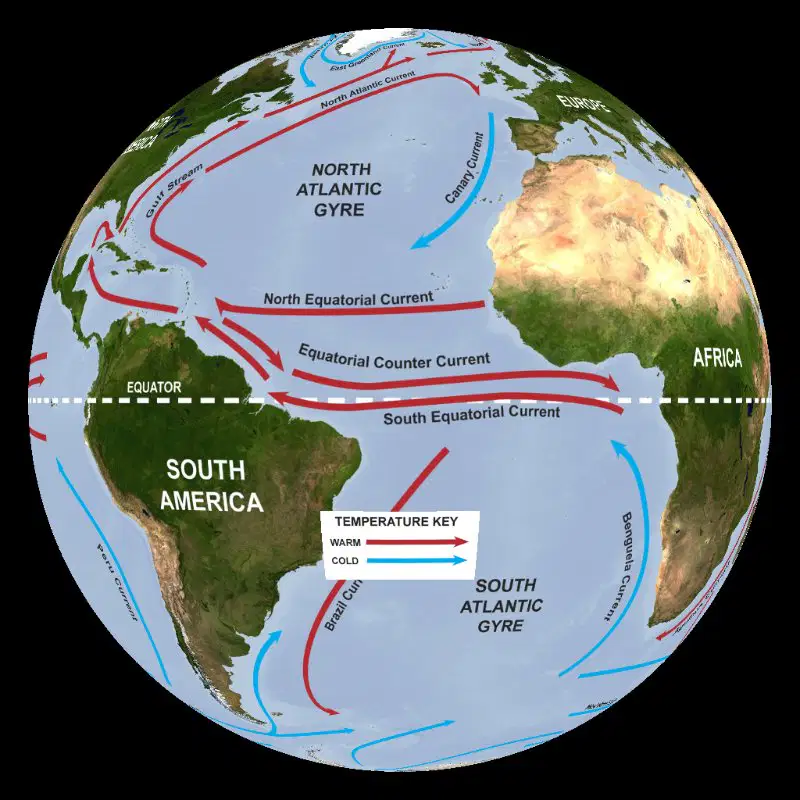
Which of the following sentences is TRUE about ocean currents? Cold ocean currents make the air warmer., Cold ocean currents bring more rain., Warm ocean currents make the air warmer., Warm ocean currents bring less rain.
Cold ocean currents make the air warmer.
Cold ocean currents bring more rain.
Warm ocean currents make the air warmer.
Warm ocean currents bring less rain.

The graph shows the average monthly temperature of cities A & B. City A has a much greater temperature range, hotter summers and colder winters than city B. This is because city A most likely
is closer to a large body of water
is at a higher elevation
is father from a large body of water
has more urban development

Is the city in climograph “A” or climograph “B” in the Southern Hemisphere?
A
B
C
D
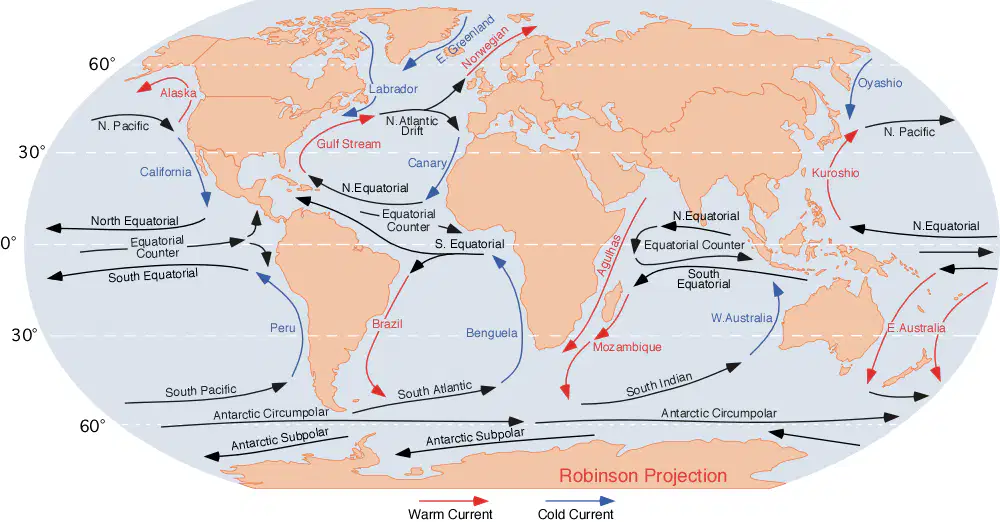
Which direction do warm currents flow FROM?
North Pole
North America
South Pole
Equator

Which statement best explains why a desert often forms on the leeward side of a mountain?
Sinking air compresses and warms.
Increased precipitation occurs due to mountain elevation.
Cool air rises and creates moisture.
Warm air holds more moisture, leading to rain.

Which graph best shows the general effect that differences in elevation above sea level have on the average annual temperature?
Graph 1
Graph 2
Graph 3
Graph 4

