
 Worksheets
Psychological Statistics Mid
Total questions: 60
Worksheet time: 1hrs 13mins
What terms refer to a characteristic or condition that changes or has different values for different individuals?
Latent Concept
Data
Variable
Construct
What do you call a value that describes a population?
Statistic
Parameter
Sample
Variable
What is the naturally occurring discrepancy, or error, that exists between a sample statistic and the corresponding population parameter?
Nonsampling Error
Systematic Error
Random Error
Sampling Error
What term refers to internal attributes or characteristics that cannot be directly observed but are useful for describing and explaining behavior?
Variable
Data
Construct
Index
What is the branch of science that deals with the collection, organization, analysis, interpretation, and presentation of data?
Algebra
Research
Statistics
Probability
Which of the following is a discrete variable?
Height of students
Number of presents
Weight of a baby
Temperature in a city
A Likert scale is what kind of scale of measurement?
Ratio scale
Interval scale
Nominal Scale
Ordinal scale
Which of the following scales of measurement has an absolute zero property?
Interval scale
Ratio scale
Ratio scale
Nominal scale
What research method attempts to establish a cause-and-effect relationship between the independent and dependent variables?
Descriptive Method
Experimental Method
Correlational Method
Nonexperimental Method
A company surveyed 100 of its customers to see their average satisfaction rating. What does the computed average satisfaction rating represent?
Parameter
Population
Sample
Statistic
What term refers to how well the measurement rule actually measures the variables under consideration as opposed to some other variable?
Reliability
Validity
Operationalization
Construct
What do you call an index of how consistently the rule assigns the same number to the same observation?
Summary measure
Validity
Reliability
Variability
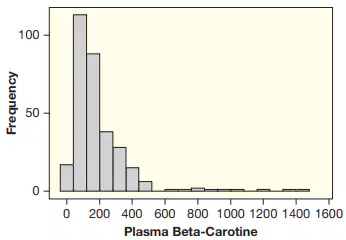
The plasma beta-carotene level, in ng/ml, was measured for a sample of n = 315 individuals, and the results are shown in the histogram. What could we describe about the shape of the distribution?
Positively-skewed
Symmetric
Negatively-skewed
Platykurtic
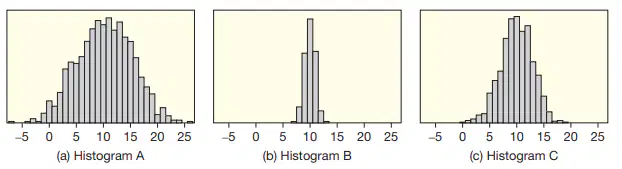
Which of the following histograms has the greatest variability?
It is hard to tell through histograms.
Histogram C
Histogram B
Histogram A
In a distribution with negative skew, where are the scores with the highest frequencies located?
On the right side of the distribution
On the left side of the distribution
In the middle of the distribution
On both ends of the distribution
A student obtained a score of 77% of an exam’s perfect score. He was told that he surpassed 80% of the class. What does 80% represent?
Percentile Rank
Percentile
Probability
Coefficient of Variation
What is the equivalent percentile for the 3rd Quartile?
75th Percentile
25th Percentile
30th Percentile
70th Percentile
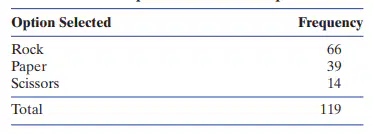
*A study observed 119 people playing Rock-Paper-Scissors. Their choices are shown in the table. What is the relative frequency for Paper?
0.12
0.66
0.33
0.55
*Given that data 1.3, 12.6, 4.6, 50.7, 6.6, 10.5, and 7.3, what is the 25th Percentile?
6.6
4.6
7.3
1.3
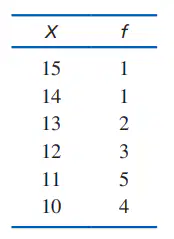
*Given the table of X and corresponding f values, what is the cumulative frequency for X = 12?
7
12
9
4
What is known as a single value we compute from a collection of measurements to describe one of the collection’s particular characteristics?
Validity
Reliability
Summary Measure
Variability
What are individual values that are substantially different (larger or smaller) from the majority of values?
Raw Scores
Outliers
Arrays
Modes
Given a set of data, if the mean is less than the median, then:
The distribution is positively skewed.
The distribution is negatively skewed.
The distribution is symmetric.
The distribution is erratic.
A student wants to compute her final grade in Mathematics that follows a grading system: Quizzes – 30%, Midterm Exam – 30%, and Final Exam – 40%. What type of mean would she use to compute her final grade?
Combined Mean
Arithmetic Mean
Weighted Mean
Trimmed Mean
The value of one score in a distribution is changed from X = 20 to X = 30. Which measure(s) of central tendency is(are) certain to be changed?
Median
Mode
Mean
Mean and Mode
*Find the mean for the following scores: 8, 7, 5, 7, 0, 10, 2, 4, 11, 7, 8, 7
6.9
6.3
7.6
7
*Find the median for the following scores: 8, 7, 5, 7, 0, 10, 2, 4, 11, 7, 8, 7
5
6
7
6.5
*Find the mode for the following scores: 8, 7, 5, 7, 0, 10, 2, 4, 11, 7, 8, 7
No mode
7
5
11
*A sample of scores has a mean of M=6 . What is the mean if a constant value of 3 is added to each score?
9
6
18
3
*A population of scores has a mean of μ=50 . What is the mean if each score is divided by a constant value of 50?
0
2500
50
1
What is the average squared distance from the mean?
Variance
Standard Deviation
Range
Interquartile Range
What is the distance between the maximum value and the minimum value?
Midrange
Interquartile Range
Variance
Range
For which of the following distributions would X=35 be most extreme?
μ=25 and σ=10
μ=25 and σ=5
μ=30 and σ=10
μ=30 and σ=5
Which of the following sets of scores has the largest variance?
12, 13, 14, 15
1, 3, 8, 12
2, 2, 2, 2
22, 24, 25, 27
A psychologist used the median in her dataset. What is the measure of variability that she would use?
Standard Deviation
Coefficient of Variation
Range
Interquartile Range
*If 5 points are added to every score in a population with a mean of μ=45 and a standard deviation of σ=6 , what are the new values for μ and σ ?
μ=45 and σ=6
μ=45 and σ=11
μ=50 and σ=6
μ=50 and σ=11
*What is the variance for the following sample of n=5 scores? Scores: 2, 0, 8, 2, 3
20.25
3
9
7.2
*What is the standard deviation for the following population of scores? Scores: 1, 3, 9, 3
9
6
3
36
*What is SS, the sum of the squared deviations, for the following population of N=5 scores? Scores: 1, 9, 0, 2, 3
10
41
95
50
*The dataset has the sample mean of M=60 and the sample standard deviation of s=12 . What is the sample coefficient of variation?
60%
20%
50%
12%
What score measures how many standard deviations an observed value is above or below the mean?
Percentile rank
Range
z-score
Degrees of Freedom
What distribution is composed of scores that have been transformed to create predetermined values for μ and σ ?
Normal Distribution
Frequency Distribution
Standardized Distribution
Sampling Distribution
Which of the following is an advantage of transforming X values into z-scores?
The distribution is transformed to a normal shape.
Dissimilar distributions can be compared.
All negative numbers are eliminated.
All scores are moved closer to the mean.
Under what circumstances would a score that is 20 points above the mean be considered an extreme score?
When the mean is much larger than 20.
When the standard deviation is much larger than 20.
When the mean is much smaller than 20.
When the standard deviation is much smaller than 20.
A score has a z-score of z=−1.75 . Which of the following describes the percentile rank of the z-score?
The percentile rank is greater than 90%.
The percentile rank is equal to 50%.
The percentile rank is greater than 50%.
The percentile rank is less than 50%.
*For a population with a standard deviation of σ=4 , a score of X=24 corresponds to z=−1.50 . What is the population mean?
30
20
28
40
*For a sample with a mean of M=63 , a score of X=54 corresponds to z=−0.75 . What is the sample standard deviation?
12
-12
9
-9
*For a population with μ=50 and σ=6 , what is the z-score for X=47 ?
0.75
-0.75
-0.5
0.5
*For a population with μ=50 and σ=6 , what is the score that corresponds to z=2.50 ?
50
56
65
60
*A cognitive psychology exam has a μ=80 and σ=9 , and a statistics exam has a μ=75 and σ=5 . Matt got a score of 85 in cognitive psychology and a score of 80 in the statistics exam. Which exam did Matt perform better on, considering the grades of the other students?
He performed better in the cognitive psychology exam.
He performed better in the statistics exam.
He performed well in both exams.
It is hard to tell which exam he performed well on.
What graph visualizes the relationship between two quantitative variables?
Scatterplot
Histogram
Boxplot
Dot plot
What is a measure of the strength and direction of linear association between two quantitative variables?
Validity
Linear Regression
Association
Correlation
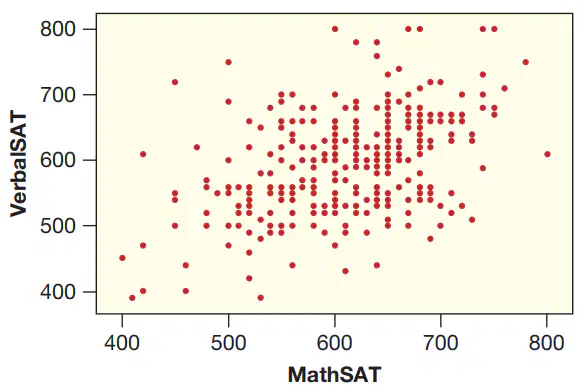
Observe the figure below. Which of the following is most likely to be the correlation between these two variables?
r = 0.445
r = -0.941
r = -0.605
r = 0.751
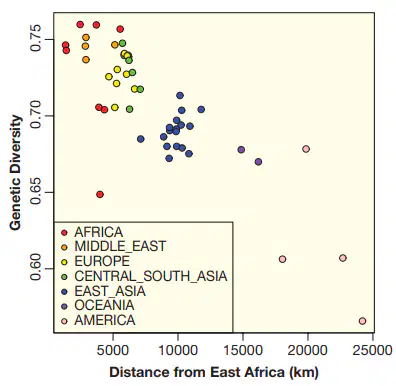
Observe the figure below. Which of the following values gives the correlation between these two variables?
r = 0.14
r = -1.22
r = -0.14
r = -0.83
Which of the following is a justified conclusion if a correlation is negative?
Increases in X are always accompanied by decreases in Y.
Increases in X are always accompanied by increases in Y.
Increases in X tend to be accompanied by increases in Y.
Increases in X tend to be accompanied by decreases in Y.

*A regression line for predicting Hgt= height in inches from Age= age in years of a child is shown in the image. What is the predicted height for a child who is 12 years old and 60 inches tall?
32.88
57.18
60
188.7

*A regression line for predicting Hgt = height in inches from Age = age in years of a child is shown in the image. What is the residual of a child who is 12 years old and 60 inches tall?
27.12
2.82
-27.12
-2.82

*A regression line for predicting Grade, grade on the exam, from Study, number of hours spent studying for an exam, is shown in the image. What is the predicted grade for a student who studied 10 hours and received an 81 on the exam?
307.8
91
81
79

*A regression line for predicting Grade, grade on the exam, from Study, number of hours spent studying for an exam, is shown in the image. What is the residual for a student who studied 10 hours and received an 81 on the exam?
3
-3
-2
2
Which of the following correlations indicates the most consistent relationship between X and Y?
r = -0.90
r = 0.80
r = 0.40
r = -0.10

