
Font size
 Worksheets
County Zoo Gift Shop Revenue
Total questions: 150
Worksheet time: 1hrs 15mins
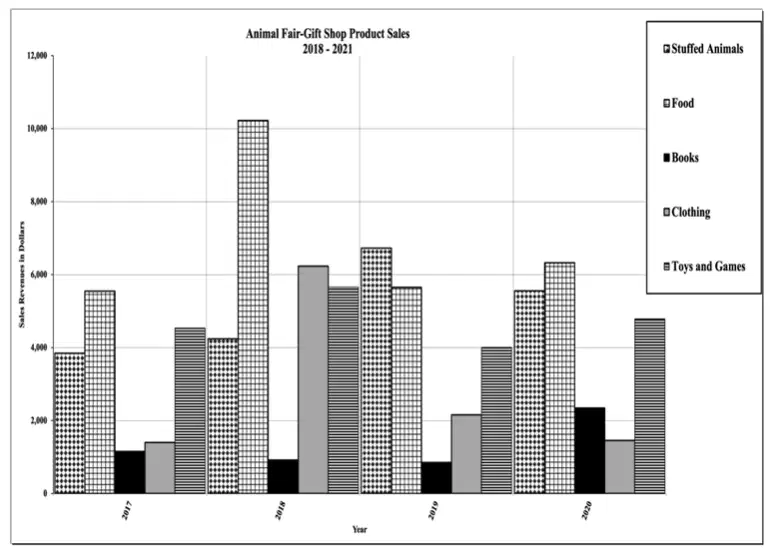
How much time is represented on the graph?
Four months
Four years
Eight months
Eight years
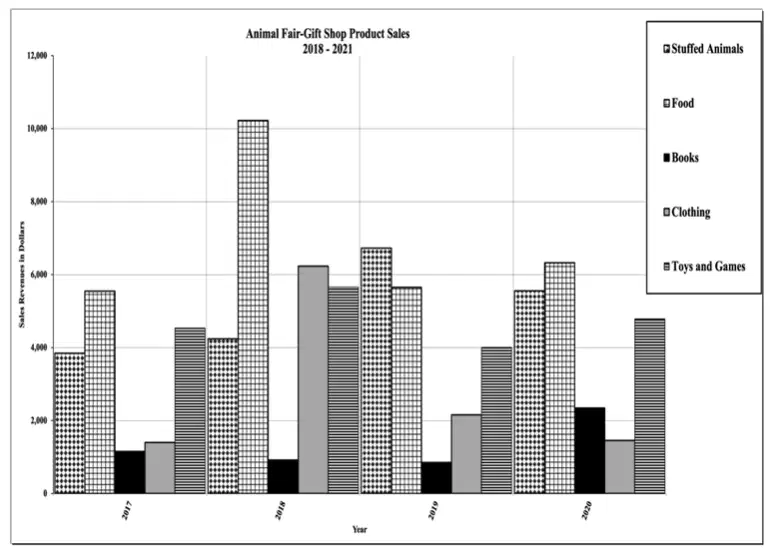
What is represented on the y axis?
The year
The number of items sold
The price of an item
The amount of revenue generated
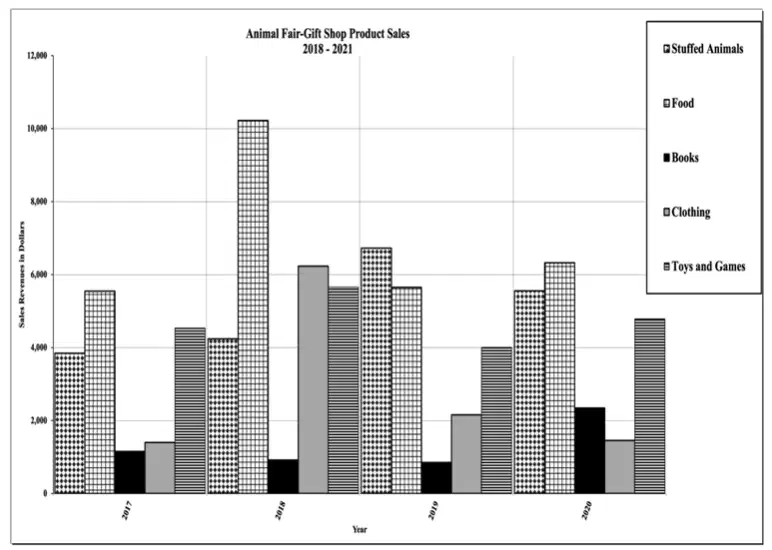
What item group created the least amount of revenue over the period of time covered by the graph?
Stuffed animals
Food
Clothing
Toys and games
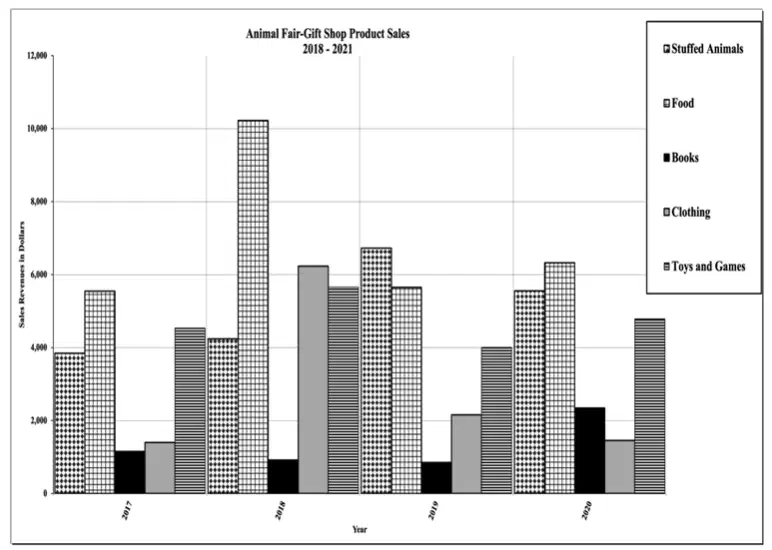
Which item had the single biggest increase in revenue from the previous year?
Stuffed animals
Food
Clothing
Toys and games
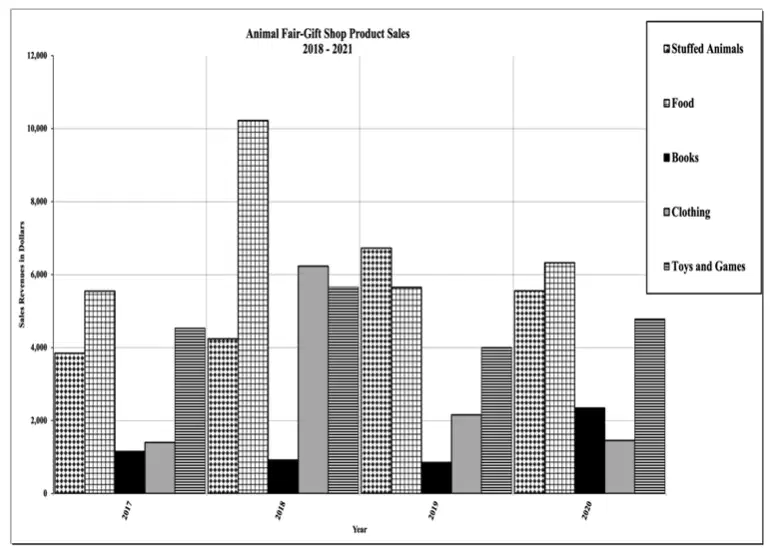
How many groups of items are represented on the chart?
1
2
5
8
How many items generated revenue of over $1,000 in 2019?
1
2
4
5
How many items generated more revenue than clothing in 2018?
0
1
3
4
In how many years did food produce revenue above $5,000?
0
1
3
4
What year did toys and games generate the most revenue?
2017
2018
2019
2020
What item had the least variation between 2017 and 2018?
Books
Food
Clothing
Toys and games
Food generated the most revenue every year that the graph covers.
True
False
The graph includes data from four different locations.
True
False
Books were the only group of items that never generated revenue above $2,500 in a single year.
True
False
Only two groups of items generated more than $20,000 over the time covered by the graph.
True
False
Stuffed animals were the only item group that increased in revenue created every year.
True
False
Which country has areas of commercial farming?
Central African Republic
Western Sahara
Morocco
None of the above
The El Djouf desert is on the border of what country?
Mauritania
Sudan
Chad
None of the above
Which of the following countries receives over eighty inches of precipitation per year?
Namibia
Egypt
Liberia
None of the above
Which of the following natural resource can be found in Madagascar?
Oil
Natural gas
Lead
None of the above
Which African city is located on the shores of the Red Sea?
Jiddah, Saudi Arabia
Luxor, Egypt
Port Sudan, Sudan
Darnah Libya
Marine climate can be found in what area of the continent?
North
West
South
East
Algeria gets the most imports from which of the following?
European Union
China
United States
All others
What is the elevation Mt. Tahat in Algeria?
Between 4,000 and 5,000 feet
Between 5,000 and 6,000 feet
Between 6,000 and 7,000 feet
Over 7,000 feet
Which country has an area where the population is over 100 people per square kilometer?
Egypt
South Africa
Morocco
All of the above
Lake Turkana is mainly in what country?
Uganda
Kenya
Congo
Chad
Most African mining companies are foreign-owned and they employ few Africans.
True
False
The climate of Nigeria is mainly desert.
True
False
The lowest elevation areas of Africa tend to be around the coastal areas.
True
False
Africa is between the Atlantic Ocean off of Africa’s east coast and the Indian Ocean off the west coast.
True
False
The Grand Erg de Bilma desert is in located in Niger.
True
False
Zoo Attendance Comparison: How many zoos are represented on the graph?
1
3
5
6
Zoo Attendance Comparison: What does the line with a square marker represent?
2017
2018
State Zoo
Capital City Zoo
Zoo Attendance Comparison: Which zoo had the steadiest attendance?
Southside
Boris
Star City
State
Zoo Attendance Comparison: Which zoo had the smallest attendance in 2015?
Capital City Zoo
Boris Zoo
State Zoo
Southside Zoo
Zoo Attendance Comparison: What year had the highest attendance at any single zoo?
2017
2018
2019
2020
Zoo Attendance Comparison: The data point for Boris Zoo in 2018 indicates what level of attendance?
246 attendees
2,460 attendees
24,600 attendees
246,000 attendees
Zoo Attendance Comparison: In how many years did Star City have higher attendance than Capital City?
0
1
2
4
Zoo Attendance Comparison: What year had the highest level of attendance for all sites combined?
2016
2017
2018
2019
Zoo Attendance Comparison: How many sites had decreasing attendance every year?
0
1
2
3
Zoo Attendance Comparison: What does the x axis represent?
Number of attendees
The month
The year
The specific attendance number and time
True/False: All locations had their lowest attendance in 2020.
True
False
True/False: Attendance never fell below 5,000 at any zoo.
True
False
True/False: Capital City Zoo attendance rose every other year compared to the previous year.
True
False
True/False: Boris Zoo had the second-best attendance level in every year.
True
False
True/False: The graph covers a time span of over three years.
True
False
Australia: The longest river in Australia runs through what part of the country?
Southeast
Southwest
Northwest
Northeast
Australia: What is the territorial capital of French Polynesia?
Canberra
Tarawa
Papeete
Manila
Australia: What’s the largest city on Australia’s west coast?
Brisbane
Adelaide
Perth
Bunbury
Australia: What is the precipitation level of Sydney?
Under 10 inches per year
Between 10 and 20 inches per year
Between 20 and 40 inches per year
Over 40 inches per year
Australia: What is the primary land cover type of Indonesia?
Cropland
Tropical rain forest
Grassland
None of the above
Australia: What body of water lies between Semarang, Indonesia and Borneo?
Java Sea
South China Sea
Celebes Sea
Molucca Sea
Australia: The Outback covers how much of Australia?
Ten percent
Twenty percent
Forty percent
Eighty percent
Australia: What is the climate of Australia’s northern coast?
Steppe
Desert
Savanna
Marine
Australia: What is the most densely populated country in Australia and Oceania?
Australia
Nauru
Palau
New Zealand
Australia: Which of the following countries is transcontinental?
Indonesia
Thailand
Vanuatu
Cambodia
Australia: On the land cover map, what does the pink line running through New Guinea indicate?
Land cover type change
Elevation change
Continental boundary
International boundary
Australia: Which of the following resources is not found in New Zealand?
Gold
Iron
Tin
Silver
Australia: How far is it from Merredin, Australia to Albany, Australia?
About 100 miles
About 250 miles
About 400 miles
About 500 miles
Australia: Mainland Australia is divided into how many states?
4
6
10
12
Australia: Which is the world’s oldest continuous culture?
Polynesian
Micronesian
Melanesian
Aborigine
Which of the following streets is one way only?
Spot St.
Twine St.
6th St.
None of the above
The nearest gift shop to the Flamingo Exhibit is in what direction?
Northwest
Southwest
Northeast
Southeast
The zoo opens at what time on Thursdays?
9:00 a.m.
10:00 a.m.
7:00 p.m.
8:00 p.m.
How is public parking accessed?
By heading west on 5th Street
By heading south on 6th Street
By heading north on 5th Street
By heading east on 6th Street
How many first aid stations are indicated on the map?
0
1
2
3
Which of the following is located directly north of the main building?
Playground
ATM machine
Gift shop
Picnic area
How far is it from the corner of 5th and Twine to the main entrance?
About 300 feet
About 600 feet
About 1,200 feet
Scale not indicated on the map
Which of the following is not located on south side of Twine Street?
State Aquarium
Art Museum
Global Theatre
All of the above
How many hours is the zoo open on Saturdays?
8
9
10
12
How many gift shops are located in the zoo?
0
1
2
4
Parking is located at the south end of the zoo.
True
False
The zoo opens and closes earlier on weekends.
True
False
There are more concessions than picnic areas.
True
False
6th street only runs north to south.
True
False
The Petting Zoo is the attraction furthest south.
True
False
What does the horizontal line going across the columns represent?
The year
Source of income
Expenses
The amount of income
How much did the zoo receive from federal grants in 2010?
$50,000
$60,000
$40,000
None of the above
What item is represented by the lightest column?
Ticket sales
Annual memberships
Federal Grants
Total expenses
What time span is covered by the graph?
Twelve months
Six months
Six years
Twelve months
What year did the zoo take in the most income overall?
2010
2011
2012
2013
How many times was revenue from private contributions higher than from federal grants?
0
1
3
5
Which source of income generated the most revenue over the time covered by the chart?
Ticket sales
Annual memberships
Private contributions
Federal Grants
In how many years did expenses outpace income?
0
1
2
4
Which year had the highest difference between revenue and expenses?
2010
2012
2014
2015
In how many years did the zoo generate more than 5 million in income?
0
1
4
6
Ticket sales increased every year.
True
False
The highest amount of income occurred in the same year as the highest amount of expense.
True
False
Ticket sales were at least double the amount of every other income source combined every year.
True
False
The strongest year for ticket sales occurred in 2015.
True
False
The numbers on the left side of the chart represent expense and revenue in millions of dollars.
True
False
The Danube River forms part of the border of what country?
Estonia
Portugal
Romania
Iceland
What city with a population of over one million is located at 48°N and 38°E?
Volgograd, Russia
Donetsk, Ukraine
Odessa, Ukraine
Voronezh, Russia
How far is it from the capital of Austria to the capital of Montenegro?
About 200 miles
About 400 miles
About 800 miles
About 1,000 miles
The island of Bornholm is a territory of what country?
Denmark
Bulgaria
Latvia
Finland
The most densely populated country is located on the shores of what sea?
Irish Sea
North Sea
Ligurian Sea
Adriatic Sea
What does the small red square on the eastern coast of Italy indicate?
Waterfalls
Seasonal lake
State capital
Small country
Which French city with a population of over one million is located on the Loire River?
Toulouse
Nantes
Lyon
None of the above
Which of the following countries have canals?
France
Belarus
Ireland
All of the above
Which of the following is located west of the Prime Meridian?
Turin, Italy
Cork, Ireland
Cologne, Germany
None of the above
What is the name of the body of water north of Hammerfest, Norway?
North Sea
Norwegian Sea
Atlantic Ocean
Arctic Ocean
Which of the following countries is intercontinental?
Russia
Turkey
Kazakhstan
All of the above
Which of the following countries has its capital on the shores of the Gulf of Finland?
Sweden
Russia
Denmark
Estonia
The Rhine River runs through what portion of Germany?
North
West
South
East
Bosnia has a disputed border with what country?
Croatia
Serbia
Montenegro
None of the above
Which river is not located in Russia?
Ob River
Ebro River
Oka River
Don River

Where is the entrance to Cortez Woods located?
The southern side
The western side
The northern side
The eastern side

Which of the following bridges leads to the longest loop trail?
Bridge 2
Bridge 3
Bridge 4
None of the above

Driving in what direction on Cortez Drive takes you to Cortez Woods?
Southeast
Northeast
Southwest
Northwest

How many unpaved trails are indicated?
0
1
3
5

Which “Point of Interest” is the furthest east?
Serenity Grove
High Trail
Founder’s Grove
Camping Ground

How far is it from the parking lot to Serenity Grove?
About half a mile
About a mile
About two miles
Scale not indicated

How many unpaved trails cross Five Mile Creek?
0
1
3
5
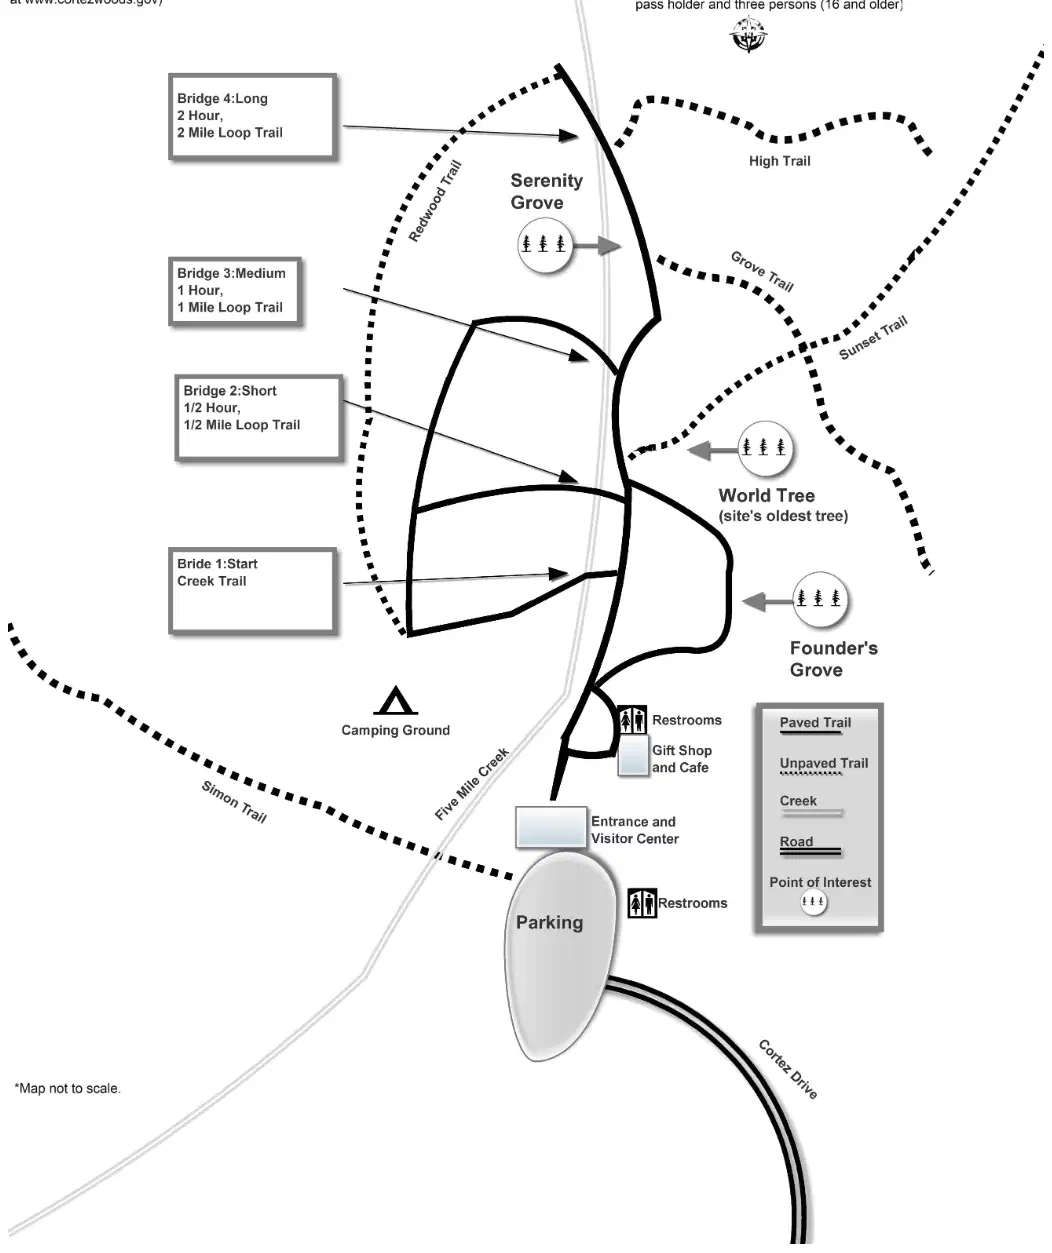
How much in the entrance fee for a fourteen-year-old?
Admission is free
$15
$45
None of the above

What trail leads to the World Tree?
Redwood Trail
Sunset Trail
High Trail
Simon Trail
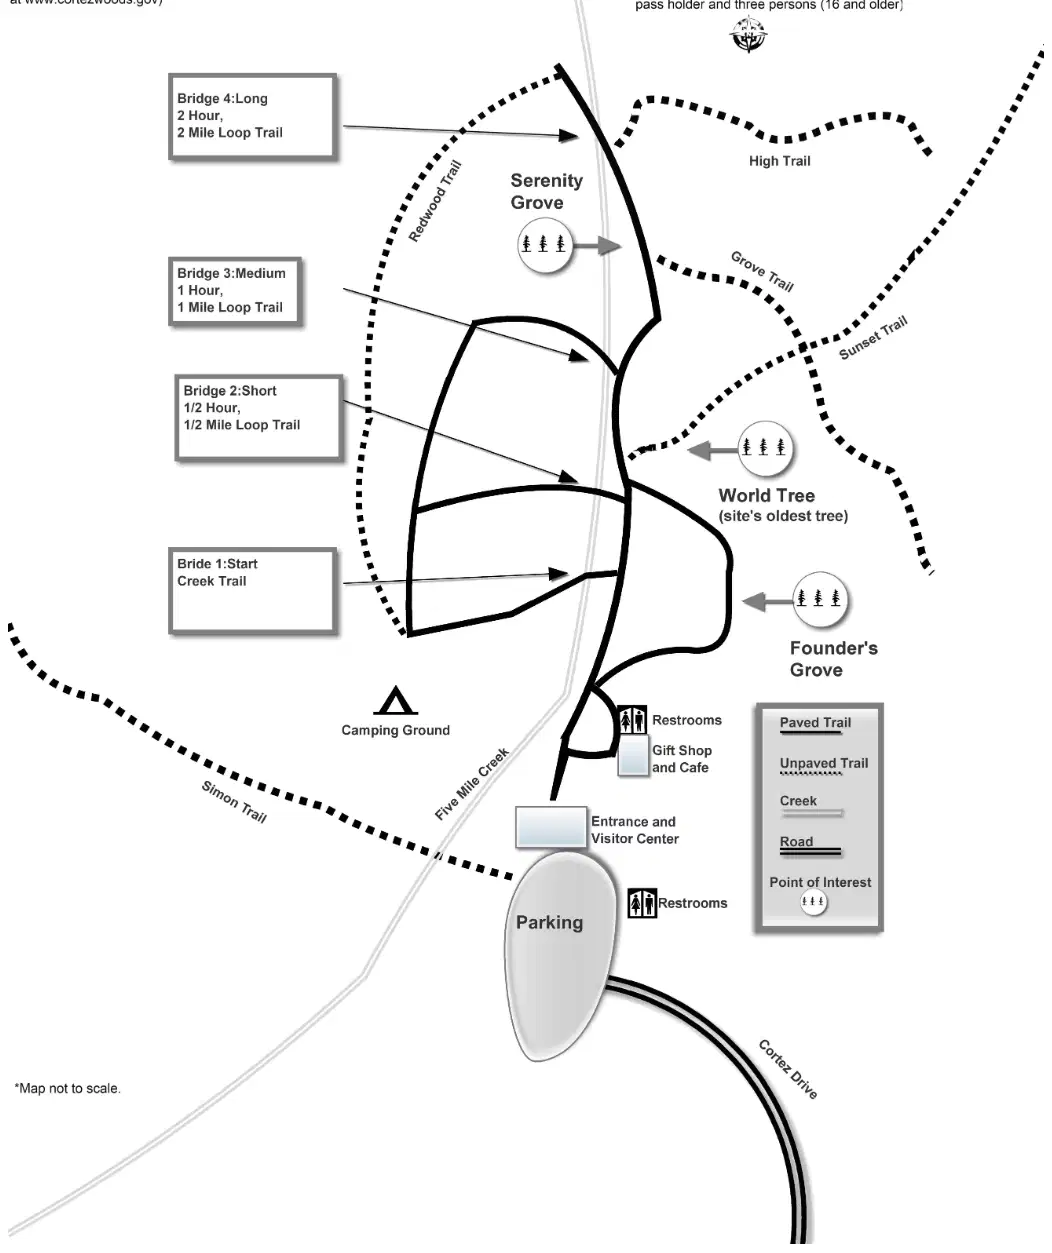
How many restrooms are indicated on the map?
0
1
2
3

There are four bridges across Five Mile Creek on the paved trails.
True
False

Overnight camping tickets are available at the Entrance/Visitor Center.
True
False

Serenity Grove is the only point of interest west of Five Mile Creek.
True
False

Simon Trail is the only unpaved trail accessible from the parking lot.
True
False

Overnight campers are free to camp anywhere west of the creek.
True
False
The largest lake on the continent is on the border of which country?
United Kingdom
Finland
Russia
Spain
What is the main land cover type of Sweden?
Tundra
Glacier
Cropland
Needleleaf Forest
Which of the following countries gets its highest percentage of electricity from fossil fuels?
Germany
Poland
Spain
Austria
How far is it from Bilbao, Spain to Valladolid, Spain?
About 150 miles
About 300 miles
About 450 miles
About 600 miles
What does a line of white dots on a Political Relief map indicate?
International boundary
Continental boundary
Canal
State boundary
Which of the following Swedish cities is located north of the Arctic Circle?
Bodo
Vadso
Kiruna
None of the above
Which of the following has negative population growth?
Russia
Albania
France
The World
Which of the following countries has a marine climate?
Moldovia
Estonia
Bosnia
Belgium
Wetlands can be found in what country?
Russia
Finland
Estonia
All of the above
What is the world’s largest country?
Canada
China
Russia
Spain
Lake Inari is located in Northern Finland.
True
False
The elevation on the coast of the Netherlands can reach above 5,000 feet.
True
False
The single country that receives the highest amount of European Union exports is the United States.
True
False
The least densely populated country is Iceland.
True
False
The Ural Mountains create the intercontinental boundary inside of Turkey.
True
False
Use the bar graph titled Average Visit Duration by Age in 2020 to answer: What does the black bar represent?
15-19 year olds
25-64 year olds
Visit durations of 2-3 hours
Visit durations of 3-4 hours
Use the bar graph titled Average Visit Duration by Age in 2020 to answer: What does the y axis represent?
The number of visitors
The age group of particular visitors
The percentage of visitors in a particular category
None of the above
Use the bar graph titled Average Visit Duration by Age in 2020 to answer: Which age group had the highest percentage of visits of four or more hours?
0-14
15-19
25-64
65 and over
Use the bar graph titled Average Visit Duration by Age in 2020 to answer: What span of time does the graph cover?
One year
Five years
Sixty-five and over
One day
Use the bar graph titled Average Visit Duration by Age in 2020 to answer: What visit duration is most common for the oldest age group?
Visit durations of 0-1 hours
Visit durations of 1-2 hours
Visit durations of 2-3 hours
Visit durations of 3-4 hours
Use the bar graph titled Average Visit Duration by Age in 2020 to answer: How many age groups are represented?
1
2
4
5
Use the bar graph titled Average Visit Duration by Age in 2020 to answer: In how many age groups were 1-2 hour visits the most common?
0
1
2
4
Use the bar graph titled Average Visit Duration by Age in 2020 to answer: In how many age groups was the percentage of 1-2 hour visits at least double that of 3-4 hour visits?
0
1
3
4
Use the bar graph titled Average Visit Duration by Age in 2020 to answer: What duration of visit was the lowest among the most age groups?
Visit durations of 0-1 hours
Visit durations of 1-2 hours
Visit durations of 2-3 hours
Visit durations of 4 or more hours
Use the bar graph titled Average Visit Duration by Age in 2020 to answer: Which age group had the highest amount of total visitors?
0-14
15-19
25-64
Data not available
True or False based on the bar graph titled Average Visit Duration by Age in 2020: Total percentage totals of all visit durations for each age group equals 100%.
True
False
True or False based on the bar graph titled Average Visit Duration by Age in 2020: One hour or less visit durations were most common across three of the four age groups.
True
False
True or False based on the bar graph titled Average Visit Duration by Age in 2020: The 15-19 age group had the highest percentage of 2-3 hour visits.
True
False
True or False based on the bar graph titled Average Visit Duration by Age in 2020: Someone in the youngest age group is the most likely to leave after less than an hour.
True
False
True or False based on the bar graph titled Average Visit Duration by Age in 2020: The 25-64 age group had the least difference between the highest and lowest amount of visit duration percentage.
True
False

