
NEW
Font size
 Worksheets
Population Statistics Quiz
Total questions: 80
Worksheet time: 40mins
According to the data, what was the percentage of urban population in Vietnam in 2020?
38.1%
60%
51%
78.1%
Based on the table, what was the percentage of urban population in Malaysia in 2020?
78.1%
36.4%
59.1%
38.1%
How many million people under 15 years old were there in Southwest Asia in 2020?
114 million
65.6 million
184.6 million
28.7 million
Based on the data provided, how many million people aged 65 and over were there in Southwest Asia in 2020? (Round to the nearest whole number)
23
18
27
30
According to the table, how many million people under 15 years old were there in Southwest Asia in 2000? (Round to the nearest whole number)
67
55
72
61
Based on the data, by how many tons per hectare was the rice yield in 2021 higher than in 2005? (Round to the nearest tenth)
11.7
8.5
15.2
5.3
Which of the following statements is correct about the European Union (EU)?
It is a major global economic center.
It is the world's leading trade organization.
It is a union of countries with equal development.
It is the largest regional organization in terms of member countries.
Which of the following is NOT a reason for free capital movement within the European Union (EU)?
Removing the need for payment transactions.
Allowing investors to choose the most profitable investments.
Opening accounts in other EU countries.
Exempting value-added tax on goods from each country.
Which statement is NOT true about the European Union (EU)?
It is a major global economic center.
There is significant economic disparity among member countries.
It is a union of countries with equal development.
All European countries participate in the EU.
Which of the following is NOT included in the free movement of labor within the European Union (EU)?
Transportation.
Communication.
Job selection.
Banking and tourism.
Which of the following statements is correct about the European Union (EU)?
The EU's GDP is larger than that of the USA.
The EU has the largest number of member countries among regional organizations.
The EU is the largest regional organization in terms of member countries.
The EU is the only regional organization with a common currency.
Which continents does Southeast Asia lie between?
Asia and Africa.
Asia and Australia.
Asia and South America.
Asia and North America.
Which two oceans border Southeast Asia?
Indian Ocean and Atlantic Ocean.
Pacific Ocean and Indian Ocean.
Pacific Ocean and Arctic Ocean.
Pacific Ocean and North Atlantic Ocean.
Where is Southeast Asia located?
South of Asia.
Next to the Atlantic Ocean.
North of Japan.
Near the equator.
What is the main terrain of Southeast Asia?
Islands and archipelagos.
Mainland and islands.
Land and sea.
Sea and islands.
Which of the following is NOT a characteristic of Southeast Asia?
Agricultural development.
Industrial development.
Economic development.
Livestock development.
Which of the following statements about Southeast Asia is NOT correct?
It is a place where major civilizations meet.
It is where major powers influence.
It is located between the continents of Asia, Europe, and Australia.
It is located deep within the continent of Asia and is very large.
What is the main reason for frequent earthquakes in the Thai Binh Duong (Pacific) region?
Storms.
Floods.
Droughts.
Earthquakes.
In Southeast Asia, which natural disaster is most common due to the tropical monsoon climate?
Storms.
Floods.
Droughts.
Forest fires.
When established, which field did ASEAN countries primarily cooperate in?
Economy.
Military.
Sports.
Politics.
What is one of the main goals of ASEAN to enhance capacity and strengthen cooperation?
Regional cooperation.
Regional competition.
Regional isolation.
Exporting local products.
Which country joined ASEAN in 1995?
Brunei.
Vietnam.
Myanmar.
Laos.
What is the main development goal of ASEAN in terms of environmental protection?
Environment.
Domestic politics.
Foreign economic relations.
Leadership.
The main terrain of the Arabian Peninsula is:
Plateau.
Plain.
High mountains.
Deep valleys.
What is the main climate characteristic of Southwest Asia?
Hot and humid.
Hot and dry.
Cold.
Cold and dry.
Most of Southwest Asia has which type of climate?
Tropical and subtropical.
Temperate and subtropical.
Temperate and tropical.
Subtropical and temperate.
Which is a typical landscape of Southwest Asia?
Tropical rainforest and dense forest.
Desert and semi-desert.
River valleys and savannas.
Hard-leaved trees and steppes.
Which mineral resource is abundant and has high reserves in Southwest Asia?
Phosphate and chromium.
Oil and natural gas.
Antimony and copper.
Apatite and coal.
Which of the following statements about the European Union (EU) is NOT correct?
The economy of member countries depends heavily on exports and imports.
The EU is one of the most developed economic regions in the world.
Restrictions on free trade are gradually being eliminated.
Member countries have abolished customs duties on goods traded among themselves.
EU investment is concentrated in which sector?
Agriculture, forestry, and fisheries.
Real estate, tourism, and banking.
Services, oil and gas extraction.
Industry, mining, and manufacturing.
Which of the following statements about the EU since its establishment is NOT correct?
The number of members and territory has continuously expanded.
The cooperation among members has been strengthened in many aspects.
Decisions are made with great importance to the economy and other member countries.
The military strength and influence of the EU have increased globally.
Which of the following is NOT a main goal of the EU?
Promoting the free movement of member countries.
Building a unified community to protect member countries.
Establishing a common market and economic and monetary union.
Strengthening cooperation and links among member countries in all aspects.
Which of the following statements is NOT true about the EU's trade sector?
Internal trade is strong.
Trade activities are among the world's leading.
The main trade is import.
The main trade is export.
What is a typical characteristic of Southeast Asia's population today?
Large population, but population growth rate is decreasing.
Natural population growth rate is increasing.
Population is concentrated in many regions.
The proportion of elderly people is increasing.
Why is food crop cultivation the main sector in agriculture in many Southeast Asian countries?
Favorable conditions, large population.
Favorable conditions, developed infrastructure.
Export demand, modern transportation.
Demand for raw materials, high value.
Which statement is NOT true about Southeast Asian society?
Countries have many ethnic groups.
One ethnic group is widely distributed.
Many religions are active.
Late exploitation history.
Which statement is true about Southeast Asia's population today?
Birth rate is decreasing, death rate is decreasing.
Birth rate is increasing, death rate is increasing.
Birth rate is decreasing, death rate is increasing.
Birth rate is increasing, death rate is decreasing.
What is a favorable condition for hydropower development in many parts of mainland Southeast Asia?
Large river systems, many countries.
Large rivers flow in mountainous areas.
Rivers flow through many terrains.
Rivers flow northwest to southeast.
Which statement best reflects ASEAN's political achievements?
Creating a peaceful, stable environment in the region.
Many member countries have reached the level of developed countries.
Infrastructure is modernized.
Living standards, education, and health have improved.
Which of the following is NOT a challenge for ASEAN countries today?
Unemployment, job loss.
Low labor productivity.
Poverty.
Uneven development.
Which statement is NOT true about ASEAN countries today?
Focus on environmental protection.
High genetic diversity.
Many countries have eliminated poverty.
High GDP growth rate.
Which statement is true about ASEAN's current achievements?
Many countries belong to developing countries.
Countries have high genetic diversity.
Poverty has been eliminated.
GDP growth rate is high.
Which statement is true about ASEAN today?
It is a strong organization in global trade.
Countries have high development levels.
Broad cooperation with many countries.
Living standards are similar among countries.
What is the geographical position of Southwest Asia in terms of international sea routes?
Pacific Ocean to Atlantic Ocean.
Indian Ocean to Pacific Ocean.
Indian Ocean to South Pacific Ocean.
South Pacific Ocean to Atlantic Ocean.
Which statement is NOT true about Southwest Asia's geographical position?
Located between Europe, Asia, and Africa.
International maritime routes are important.
No territorial disputes.
Many economic exchanges.
Which statement is NOT true about Southwest Asia's natural environment?
Many mountains and plateaus.
Most of the area is desert and semi-desert.
Climate is continental and colorful.
Many wild animals.
Why does Southwest Asia have a hot climate?
Many high mountains and plateaus.
Located between deserts and semi-deserts.
Large area of the Lưỡng Hà plain.
Arabian Peninsula and many deserts.
Based on the data of EU population from 2004 to 2021, which type of chart is most suitable to represent the population of the EU during this period?
Pie chart.
Line chart.
Column chart.
Area chart.
Based on the data of EU population from 2004 to 2021, which type of chart is most suitable to show the rate of population growth in the EU during this period?
Pie chart.
Line chart.
Column chart.
Area chart.
Based on the data of population and GDP of the EU, USA, and Japan in 2021, which type of chart is most suitable to represent both population and GDP of these regions?
Line chart.
Pie chart.
Area chart.
Column chart.
Based on the data of export and import values of goods and services of the EU from 2000 to 2021, which combination of charts is most suitable to represent this data?
Column, line, and area charts.
Combination, column, and area charts.
Area, pie, and line charts.
Pie, line, and column charts.
According to the data, which type of chart is most suitable to show the scale and structure of export value of goods and services of the world and some countries/regions in 2013 and 2022?
Line chart
Column chart
Area chart
Pie chart
Based on the data for the export and import value of goods and services of the EU from 2000 to 2021, which type of chart is most suitable to represent this information?
Line chart
Combined chart
Area chart
Pie chart

What does the chart about Cambodia's export and import from 2015 to 2020 show?
Scale and structure of export and import
Change in scale of export and import
Growth rate of export and import
Shift in structure of export and import

What does the chart about rice production in Laos and Malaysia from 2015 to 2021 show?
Change in rice export structure
Rice production volume over time
Growth rate of rice exports
Shift in rice production methods
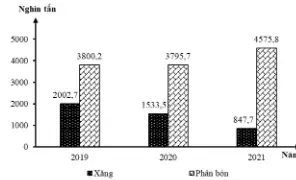
What does the chart about some imported goods of Vietnam in 2019, 2020, and 2021 show?
Change in production structure.
Comparison of production scale.
Scale and structure of production.
Rate of production increase.
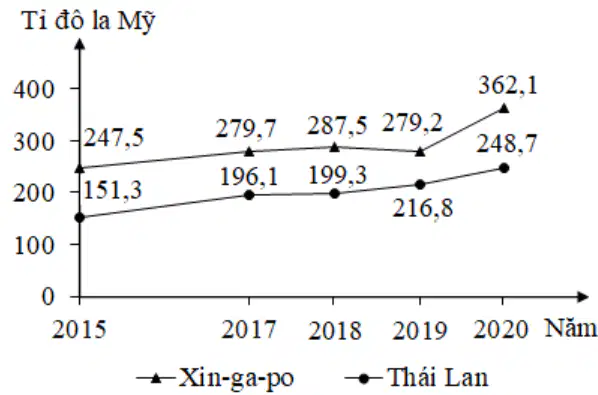
What does the chart about the total international reserves of Singapore and Thailand from 2015 to 2020 show?
Structure of total reserves.
Rate of increase of total reserves.
Shift in structure of total reserves.
Change in scale of total reserves.
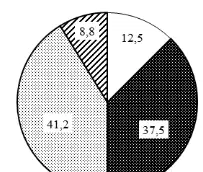
What does the chart about the total real GDP by economic sector in Vietnam in 2015 and 2021 show?
Scale of total GDP.
Change in structure of total GDP.
Scale and structure of total GDP.
Rate of GDP growth.
Which of the following is a favorable condition for economic development in Southeast Asia?
Frequent natural disasters
Favorable geographical location for cooperation
Ethnic conflicts
Economic crises
What is one of the main difficulties faced by Southeast Asian countries in economic cooperation?
Abundant natural resources
Similar historical backgrounds
Ethnic and sovereignty conflicts
Favorable climate
Which age group in Southeast Asia saw an increase in its percentage of the population from 2000 to 2020?
Under 15 years old
15 to 64 years old
65 years old and above
All age groups
What was the natural population growth rate (%) in Southeast Asia in 2020?
1.6%
1.3%
1.1%
2.0%
Which of the following is NOT a favorable condition for cooperation among Southeast Asian countries?
Shared cultural traditions
Similar historical backgrounds
Frequent economic crises
Abundant natural resources
According to the data, what was the population of Southeast Asia in 2010?
525.0 million
596.8 million
668.4 million
700.0 million
Which of the following is a social challenge affecting economic development in Southeast Asia?
Unique cultural diversity
Frequent religious conflicts
Favorable climate
Abundant mineral resources
What is a positive impact of Southeast Asia's geographical location?
Increased competition from global powers
Favorable conditions for economic development and cooperation
Frequent natural disasters
Ethnic conflicts
Which of the following is a reason for the slow economic growth in Southeast Asia?
Favorable geographical location
Economic crises and frequent natural disasters
Abundant natural resources
Shared cultural traditions
From 2000 to 2020, which age group in Southeast Asia decreased in percentage?
Under 15 years old
15 to 64 years old
65 years old and above
All age groups increased
What was the population (in millions) of Southeast Asia in the year 2020 according to the provided data?
668.4
525.0
596.8
700.0
In 2020, what percentage of the Southeast Asian population was under 15 years old?
25.2%
31.8%
28.0%
22.4%
Which age group in Southeast Asia saw an increase in its population percentage from 2000 to 2020?
15 to 64 years old
Under 15 years old
Over 65 years old
All age groups
What was the natural population growth rate (%) in Southeast Asia in 2020?
1.1%
1.6%
1.3%
2.0%
In 2020, which country had the highest percentage of GDP from services among Cambodia, Thailand, and Vietnam?
Thailand
Cambodia
Vietnam
Laos
According to the 2020 data, which country had the highest percentage of GDP from agriculture, forestry, and fisheries?
Cambodia
Vietnam
Thailand
Malaysia
What percentage of Vietnam's GDP in 2020 came from industry and construction?
36.7%
33.1%
34.8%
41.8%
Which country had the lowest percentage of GDP from agriculture, forestry, and fisheries in 2020?
Thailand
Vietnam
Cambodia
Indonesia
According to the 2021 Vietnam Statistical Yearbook, which country had the highest percentage of GDP from the service sector in 2020?
Thailand
Cambodia
Vietnam
Laos
In 2020, what was the percentage of Vietnam's GDP from the industrial sector?
36.7%
41.8%
33.1%
58.3%
Which country had the lowest percentage of GDP from agriculture in 2020?
Thailand
Vietnam
Cambodia
Laos
What was the percentage of Cambodia's GDP from the construction sector in 2020?
6.2%
8.8%
22.4%
36.6%

