
 Worksheets
U3: 2-variable Statistics
Total questions: 25
Worksheet time: 2hrs 32mins

The regression line on this scatter plot shows what type of correlation?
Positive
Negative
Random
Strong




What type of correlation does this scatterplot display?
Positive
Negative
No Correlation


Which graph shows a line of best fit for the scatter plot?
Graph A
Graph B
Graph C
Graph D
Describe the correlation, if the correlation coefficient is r = -0.26
Positive, weak
Negative, weak
Positive, strong
Negative, strong

Describe the correlation coefficient if
r = 0.90
Positive, weak
Positive, strong
Negative, weak
Negative, strong
Which scatterplot suggests a linear relationship between x and y?


Which box plot represents the data below?
90, 91, 93, 93, 95, 96, 98, 99, 101, 110, 112, 113, 123, 125, 126
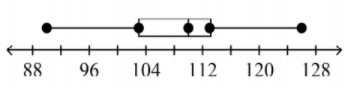
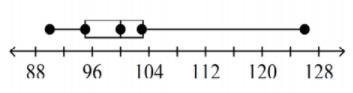
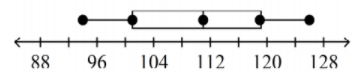
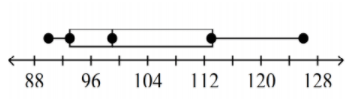
2, 5, 12, 15, 19, 4, 6, 11, 16, 18, 12, 12, 42
What effect does removing the outlier have on the distribution of the data?

Find the IQR of the distribution.
(only type in the number)
(a)




The scatter plot below shows the number of books read by students in Mrs. Hall’s English class and their final grades. Which statement represents the best description about the line of best fit?
The more books students read, the lower their English grade.
The more books students read, the higher their English grade.
The fewer books students read, the higher their English grade.
No relationship exists between the number of books students read and their English grades.

Estimate the correlation coefficient for this scatterplot.
A) r = 1.2
B) r = 0.89
C)r = 0
D) r = -0.89

Estimate the correlation coefficient for this scatterplot.
A) r = -0.9
B) r = 1
C) r = 0.9
D) r = -1
Which scatter diagram shows the strongest positive correlation?


The linear regression equation for the data is y = 1.5x + 12. Interpret the slope of the equation.
The slope is (0, 1.5). It means that a pizza with 0 toppings will cost 1.5 dollars.
The slope is 1.5. It means that it costs 1.5 dollars per topping.
There are 1.5 toppings.
There are 1.5 pizzas.

Given the following table. Use your calculator to find the line of regression. Round slope and y-intercept to the nearest tenth.
y=1.3x−2.9
y=2.9x+1.3
y=1.2x−2.8
y=1x−3

Using the equation
y=1.3x−2.9 predict how many seconds it will take 100 people to do the wave?127
127.1
10
10.1

