
 Worksheets
Algebra I SOL Review - Data Cycle and Modeling Units 1 and 9
Total questions: 40
Worksheet time: 1hrs 9mins

The school counselor at Jefferson Middle School investigated the relationship between a student's video game usage and the number of push-ups they can do in one minute. The table shows a sample of the data collected by the counselor.
How many push-ups can you do in one minute?
How many video games do you own?
What is your favorite video game character?
How many hours do you spend playing video games on a typical day?
What times of day do you usually play video games?
Which of the following questions is appropriate for investigating the relationship between two variables using a scatterplot?
How many students prefer chocolate over vanilla ice cream?
What is the relationship between study time and GPA among college students?
Which brand of smartphone is most popular among teenagers?
How often do people visit the gym each week?
Which investigative question is best addressed by collecting bivariate data?
What is the favorite color of students in a class?
How does the number of hours of screen time per day affect sleep quality?
What is the total number of books read by students in a year?
How many students participate in extracurricular activities?
Which question would require a scatterplot to analyze the relationship between two variables?
What is the most popular genre of music among teenagers?
How does the amount of fertilizer used impact crop yield?
What is the total number of participants in a community event?
How many people prefer tea over coffee?
A researcher is studying the relationship between the number of hours students study and their scores on a math test. Which pair of variables would be most appropriate to use in a scatterplot for this study?
Number of hours studied and the age of students
Number of hours studied and math test scores
Math test scores and the number of students in the class
Age of students and the number of questions on the test
A scientist is investigating whether the amount of rainfall affects the growth of a particular plant species. Which two variables should be plotted on a scatterplot to analyze this relationship?
Amount of rainfall and temperature
Growth of the plant species and time of day
Amount of rainfall and growth of the plant species
Temperature and growth of the plant species
In a study to determine if there is a relationship between the distance a person drives to work and the amount of gas they use, which of the following is the most suitable set of variables to represent in a scatterplot?
Distance driven and age of the vehicle
Distance driven and amount of gas used
Amount of gas used and time spent in traffic
Time spent in traffic and age of the driver
A company wants to investigate if there's a correlation between the number of sales calls made by its employees and the revenue generated. Which variables should be represented in a scatterplot for this analysis?
Number of sales calls and the number of employees
Revenue generated and the number of sales calls
Number of employees and the average sales call duration
Revenue generated and the total number of products sold
Which of the following is the most appropriate method to collect a representative sample for investigating the relationship between hours studied and test scores using a scatterplot?
Surveying only students who scored above 90%
Selecting every 10th student from the school roster
Asking the top 5 students in each class
Choosing students who volunteer to participate
You want to explore the relationship between the number of hours spent exercising and overall health. What sampling method would best ensure that your scatterplot accurately represents the entire population?
A. Simple random sampling of all age groups
B. Sampling only people who visit the gym regularly
C. Selecting participants based on their health condition
D. Choosing individuals from one specific neighborhood
To investigate the relationship between time spent on homework and grades, which sampling method would most likely yield a representative sample for your scatterplot?
Selecting only students who receive tutoring
Randomly choosing students from different grade levels
Surveying students who attend after-school programs
Choosing students based on their GPA

Which best describes the relationship of the data shown on this scatterplot?
No relationship
Negative relationship
Constant relationship
Positive relationship

The scatterplot below shows the scores several students received in a math and music class last semester. Which statement describes the relationship in the scatterplot?
A. Positive because as the math scores decrease, the music scores increase.
B. Negative because as the math scores increase, the music scores decrease.
C. Constant because as the math scores decrease, the music scores do not change.
D. Positive because as the math scores increase, the music scores increase.
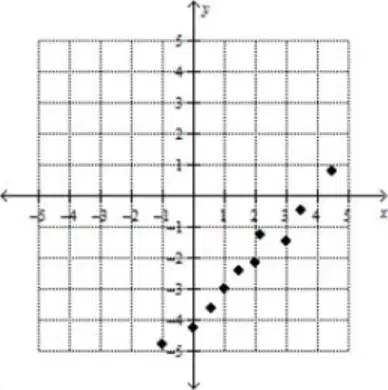
Look at the scatter plot labeled A. What type of correlation is shown in the graph?
Positive correlation
Negative correlation
No correlation

Look at the scatter plot labeled B. What type of correlation is shown in the graph?
Positive correlation
Negative correlation
No correlation
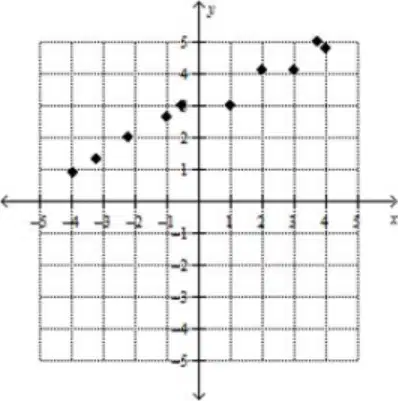
Look at the scatter plot labeled C. What type of correlation is shown in the graph?
Positive correlation
Negative correlation
No correlation

Look at scatter plot D. What type of correlation is shown in the graph?
Positive correlation
Negative correlation
No correlation

Look at scatter plot E. What type of correlation is shown in the graph?
Positive correlation
Negative correlation
No correlation
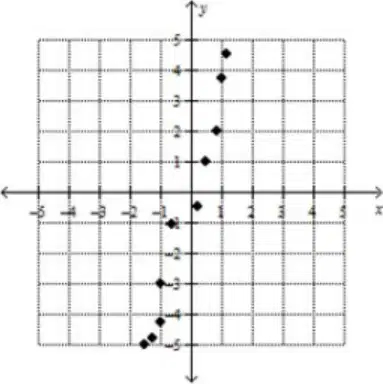
Look at scatter plot F. What type of correlation is shown in the graph?
A) Positive correlation
B) Negative correlation
C) No correlation

Which statement regarding the scatter plot below is true?
The scatter plot shows no association between hours spent watching TV and hours spent playing outside.
The scatter plot shows a negative association between hours spent watching TV and hours spent playing outside.
The scatter plot shows a positive association between hours spent watching TV and hours spent playing outside.
The scatter plot shows a nonlinear association between hours spent watching TV and hours spent playing outside.
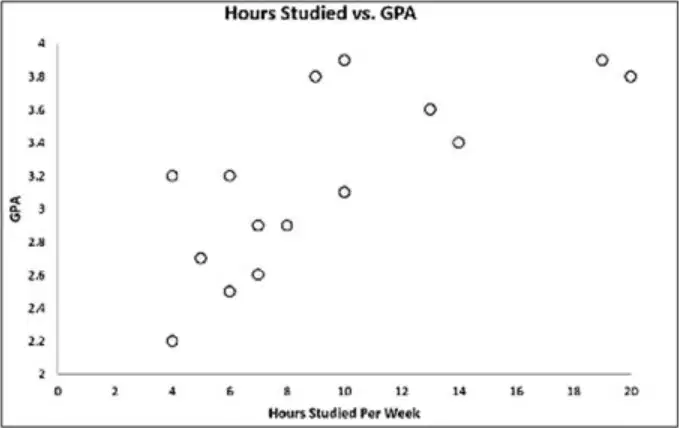
The scatterplot below was made from data collected in a simple random sample from your high school to investigate relationships between hours studied per week and Grade Point Average (GPA). You meet two students at your school, KJ and Isabel, and ask them about their study habits. KJ says he studies 12 hours per week, and Isabel says she studies 4 hours a week. Which prediction about their GPA’s is most likely to be true?
KJ and Isabel have the same GPA.
KJ’s GPA is higher than Isabel’s GPA.
Isabel’s GPA is higher than KJ’s GPA.
KJ doesn’t have a GPA.

Data was collected on the height and top speed of various roller coasters and is shown on the scatterplot below. You are going on a new roller coaster and know that it is 290 feet tall. What is your best prediction for the top speed of the roller coaster?
55 mph
85 mph
115 mph
300 mph
A scatterplot displays the relationship between the amount of time spent exercising and body weight. The points are scattered with no clear pattern. What conclusion can be drawn from this scatterplot?
As exercise time increases, body weight always decreases.
There is a strong positive correlation between exercise time and body weight.
No conclusion about the relationship between exercise time and body weight can be made from this scatterplot.
Exercise time and body weight are inversely related.
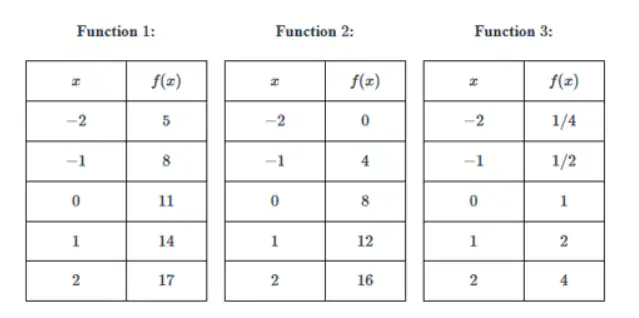
Consider the three functions represented by the tables: Which function increases at a faster rate as x increases?
Function 1
Function 2
Function 3
All of the functions have the same rate of change.
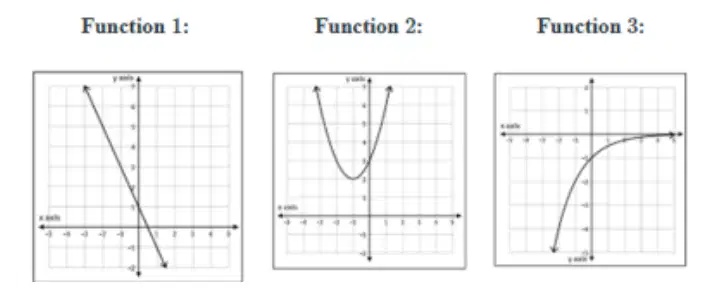
Consider the three functions: Which function is a decreasing function?
Function 1
Function 2
Function 3
All of the functions are decreasing.
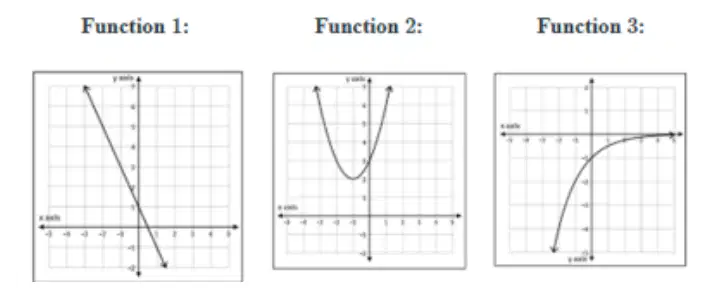
Which function has a minimum value?
Function 1
Function 2
Function 3
All of the functions have a minimum value.
How can you identify a quadratic function from a table?
The output values increase by a constant amount
The output values increase by a constant ratio
The second differences are constant
The first differences are always the same
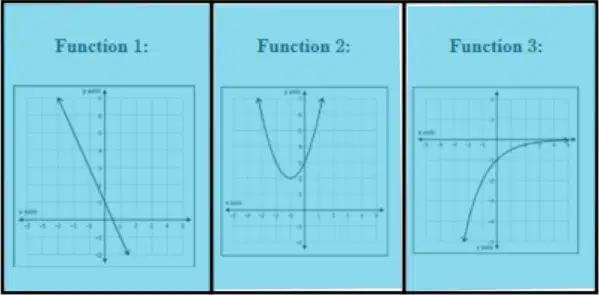
Select the function that represents an exponential function.
Function 1
Function 2
Function 3
Which function does NOT have a y-intercept of 2?
y = (x + 10)/5
y = 4(x + 0.5)
y=x2+7x+2
y = (x - 2)(x + 5)

Consider the table shown. Determine whether a linear or quadratic function best represents the relationship. Then choose the equation of best fit.
A. linear; y = x - 3
B. linear; y = 3x - 3
C. Quadratic; y = −x2+2x−3
D. Quadratic; y = −x2+3x−3
The principal at Washington High School investigated the relationship between a student’s cell phone use and the student’s grade point average, GPA. The correlation coefficient for the curve of best fit is -0.9864. Based on the data, there appears to be -
no relationship
a weak relationship
a strong relationship
a positive relationship
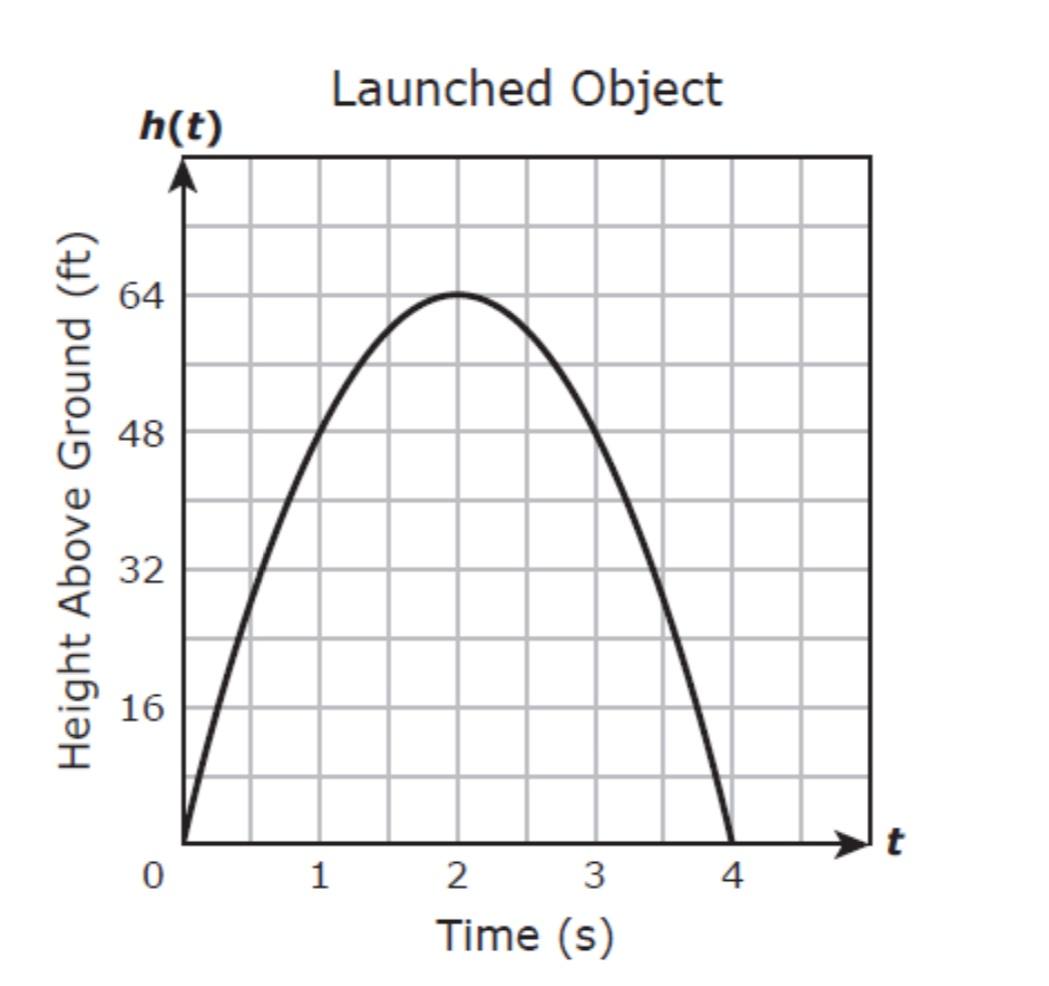
Th graph shows the height in feet of an object above the ground t seconds after it was launched from the ground. Which function is best represented by the graph of this situation?
h(t) = -16t2 - 64t
h(t) = -16t2 + 128t -256
h(t) = -16t2 + 64t
h(t) = -16t2 - 128t - 256
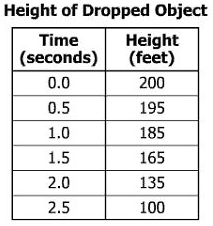
A scientist dropped an object from a height of 200 feet. She recorded the height of the object in 0.5-second intervals. Her data is shown.
Based on a quadratic model, which best approximates the height at 3 seconds?
52 feet
55 feet
65 feet
80 feet

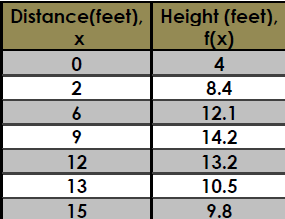
Using the quadratic curve of best fit, find the height of the ball when it traveled a distance of 10 feet.
12.8 ft
13.3 ft
11.1 ft
17 ft

Look at the data in this table.
Which equation most closely represents the line of best fit for this data?
y=1.77x+0.13
y=0.56x−0.05
y=0.5x
y=2x

The number of complaints a company received at the end of each of six weeks is shown in this table.
Based on the line of best fit, how many complaints should the company expect at the end of week 8?
75
91
96
110
For which set of data would a linear model best fit?


Based on this pattern, would a Linear or Quadratic model be most appropriate?
Quadratic
Linear

