
Font size
 Worksheets
Measurement Methods in Behavior Analysis
Total questions: 22
Worksheet time: 16mins
When using visual analysis to interpret graphed data within a phase, what 3 elements are considered to determine stability?
Slope, degree, & celeration
Trend, internal validity, and slope
Level, trend, & variability
Level, differentiation, and clinical judgmen
In the assigned reading for tonight, Putnam, Handler, Ramierez-Platt, and Luiselli (2003) used what primary method of data collection to measure their dependent variable?
Momentary Time Sampling
Partial Interval Recording
Whole Interval Recording
Permanent Product
Considering discontinuous measurement systems, which method tends to reflect an "underestimation" of the true occurrence of a target behavior?
, Not Selected
Correct answer:
, Not Selected
Frequency Measures
Whole-Interval
Partial Interval
Duration
Which method of measurement is used when an occurrence of the target behavior is counted only if the target behavior occurs as the interval ends, frequently in the last second of the interval?
Partial Interval
Whole Interval
Momentary Time Sampling
When designing a strong measurement system for a single case design, it is important to consider changing your measurement method as many times as necessary throughout the evaluation so that you always making data based decisions.
true
false
According to Ledford, Lane, & Severini (2017), there are 6 data characteristics that should be considered when conducting a strong visual analysis of graphed, single subject data. In addition to level, trend, and variability, what are the remaining 3 characteristics?
Validity, Reliability, & Believability
Level, Trend, and Variability but by a 2nd observer
Consistency, Overlap, & Immediacy
Immediacy, Overlap, & Y-Axis Scale
A researcher wants to determine whether a new reading intervention increases fluency. Which of the following represents the “best” dependent variable?
The reading curriculum
The number of sessions
The student’s reading rate
The teacher’s prompts
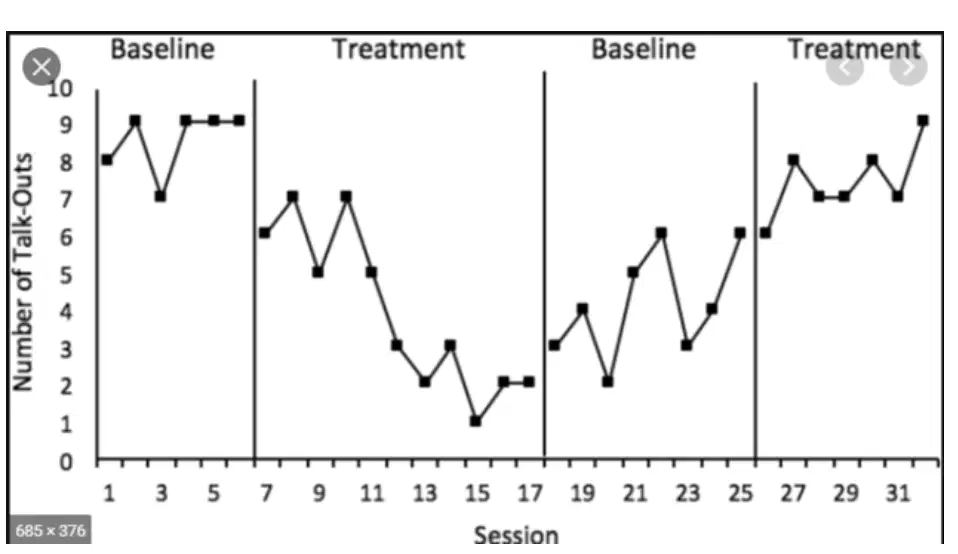
In the graph below, there are 3 opportunities to demonstrate a basic (experimental) effect. Evaluate the trends within and between phases to determine how many basic effects are actually demonstrated in the graphed example?
0
1
2
3
4

The data presented in the graph below evidence a very strong functional relationship between decreases in the number of talk-outs (dependent variable) per session and the implementation of the treatment (independent variable).
true
false
In your own words, describe one strength of the ABAB design and 1 limitation (e.g., a situation where this design would not be appropriate).
Which of the following is a key feature of multiple baseline designs that helps address ethical concerns associated with treatment withdrawal while strengthening the possible demonstration of experimental control?
Use of random assignment
Time-lagged introduction of the independent variable
Use of alternating treatments within the same phase
Inclusion of a control condition throughout the study
Multiple Baseline Designs can only be used when you have 3 or more different participants
true
false
An alternating treatments design must always include a baseline phase?
true
false
A changing criterion design must always include a baseline phase.
true
false
A multiple baseline design always requires a baseline phase.
true
false
Select the strongest type of multiple-baseline design from the options below:
Non-concurrent MBL
Multiple Probe (MBL) Design
Concurrent MBL
Multiple Treatment Interference (e.g., carry over effects) are more likely to pose a threat to internal validity with which type of SCD?
, Not Selected
, Not Selected
Correct answer:
Multiple Baseline (across participants) Design
ABAB Design
Changing Criterion Design
Alternating Treatments Design
Multiple Baseline (across participants) Design
Treatment fidelity refers to what?
The overall wholesomeness of a treatment
The degree to which data on a dependent variable collected by two or more independent observers "match"
The degree to which data on a dependent variable collected by two or more independent observers "match"
, Not Selected
The extent to which an independent variable is implemented as intended
In your own words, describe an example where a BCBA or researcher would use an alternating treatments design without collecting "pre-treatment" baseline data.
When considering various methods of calculating interobserver agreement for event based data (i.e., frequency counts) which IOA calculation method is considered the least stringent of the options below?
Mean Count per Interval
Total Count IOA
Exact Count per Interval
Using single subject research methods, nearly all methods of collecting social validity data/measures require repeated, direct observation.
true
false
When calculating IOA for event-based data, which method requires transforming your data by "adding intervals"?
Correct answer:
Total Count IOA only
Total count IOA and Mean Count per Interval
Exact Count per Interval & Mean Count per Interval
Discontinuous Measurement & Continuous Measurement

