
 Worksheets
Data Storytelling
Total questions: 20
Worksheet time: 10mins
What is data storytelling?
The use of statistics to test hypotheses.
The process of collecting large datasets.
The process of cleaning data.
The combination of data, visuals, and narrative to communicate insights.
Which of the following is NOT a core element of data storytelling?
Programming
Visualisation
Narrative
Data
A data story should always include all available data.
True
Maybe
False
Which visual is most appropriate to show trends over time?


Why is the audience important in data storytelling?
They choose the data source.
They determine the size of the dataset.
They influence the design, language, and focus of the story.
They decide the statistical method used.
Good data storytelling can influence decision-making.
True
Maybe
False
Which practices improve clarity in a data story?
Removing unnecessary visuals
Using consistent labels and scales
Adding as much data as possible
Highlighting key insights

Which methods can be used to handle missing data?
Deleting rows with missing values
Imputing values (mean, median, mode, etc.)
Ignoring missing values completely
A dashboard with too many visuals mainly causes:
Cognitive overload
Higher engagement
Better insight
Faster decisions
Which of the following is an example of missing data?
Age = 25
Income = NULL
Gender = Male
Country = Malaysia
Which component turns data into a meaningful message?
Narrative
Database
Storage
Algorithm
What are the suitable data visualization tools?




When should data cleaning be performed?
Only during data collection
Only after analysis
Before and during analysis
Only when errors are found
Which chart is most suitable for comparing categories?

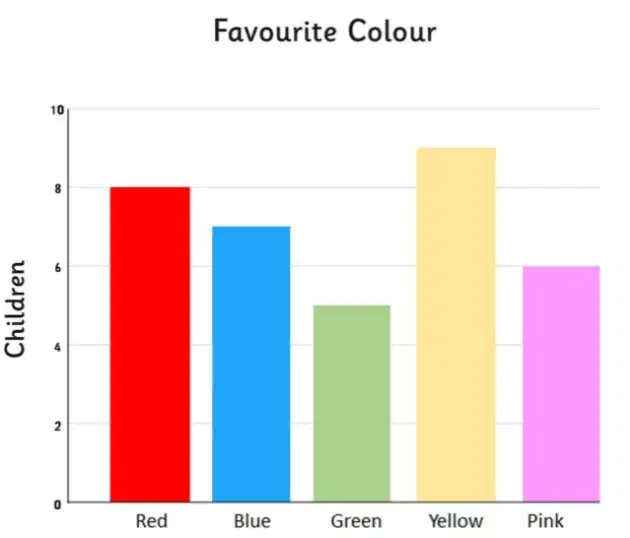
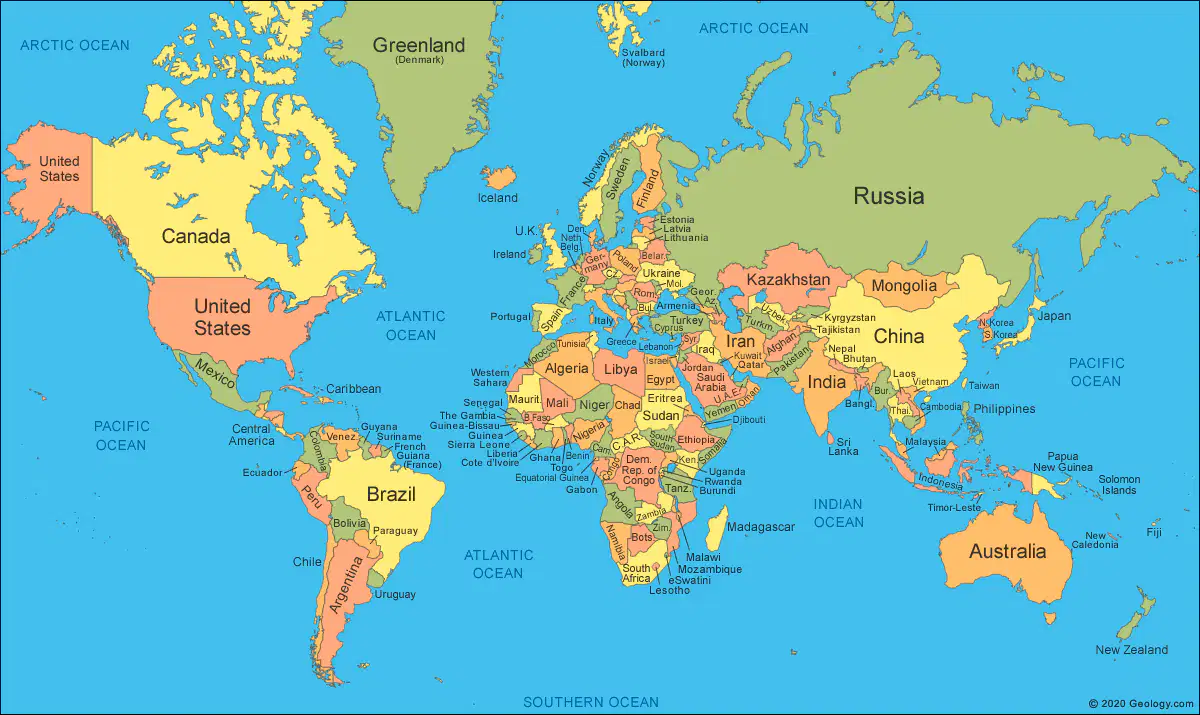
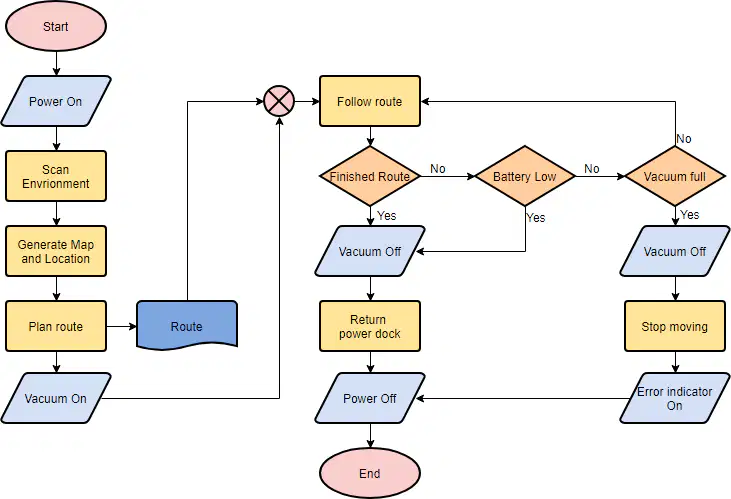
When communicating data, what should you consider first?
The size of the dataset
The audience and their needs
The software you will use
The colour of the charts
Which practice is unethical in data visualisation?
Manipulating axes to exaggerate trends
Using clear labels
Citing data sources
Showing uncertainty
What is the role of narrative in data journalism?
To simplify data by removing detail
To replace evidence
To focus on emotions only
To organise and explain findings in a meaningful way
Which tool is commonly used to create interactive dashboards?




What should a data journalist do before publishing a data-driven story?
Hide the data sources
Verify the data and check for errors
Add more visuals
Remove uncertainty

Graphical integrity is mainly about:
Speed
Style
Honesty
Interactivity

