
 Worksheets
Quantitative Methods in Finance Quiz 4
Total questions: 20
Worksheet time: 10mins

Which phenomenon specifically happens to time series data, where the error ε varies with εt-n?
Heteroskedasticity
Autocorrelation
R-squared
Goodness of fit
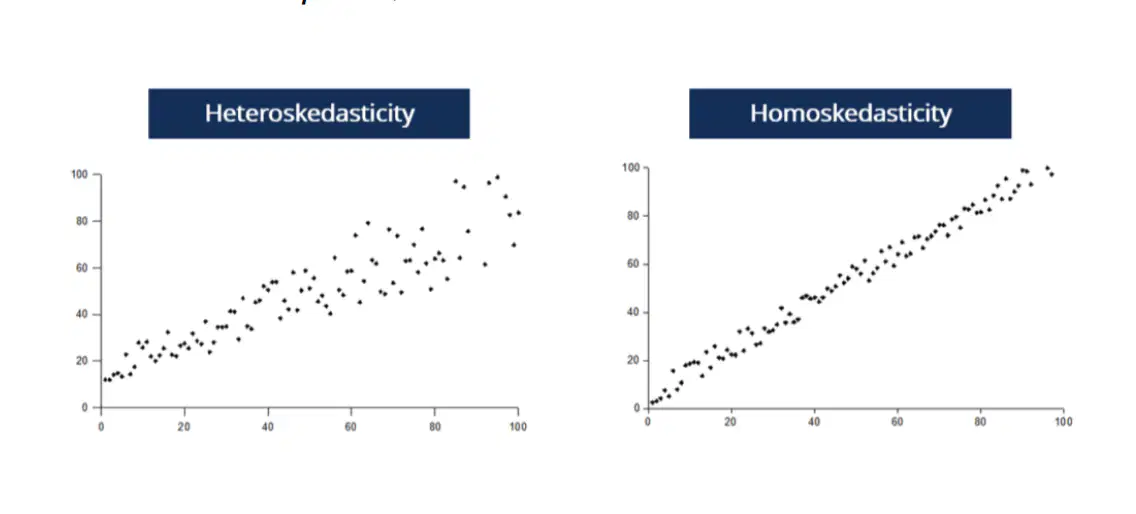
What is occurring when the error term ε varies with the independent variable X?
Homoskedasticity
Autocorrelation
Heteroskedasticity
Standard error
Under which condition is an OLS t-test considered valid?
When there is high autocorrelation
Only if there is homoskedasticity and no autocorrelation
When the R² is exactly 0.15
When the error term varies with X
If a dataset exhibits heteroskedasticity or autocorrelation, which method provides more precise estimates?
Standard OLS
Robust methods
Range calculation
Simple mean average
In a regression model, what does it mean if a coefficient is equal to zero?
The independent variable has a strong effect
The independent variable has NO effect on the dependent variable
The model has a perfect fit
The null hypothesis must be accepted
Which of the following is a requirement for t-tests of the difference of means?
The observations are dependent
The observations are (approximately) normally distributed
The observations have varying amounts of variance
The observations must be categorical only

How are OLS predicted values (ŷᵢ) calculated?
Using measured x variables and regression coefficients (e.g., yᵢ = a + bx₁ᵢ + cx₂ᵢ)
By adding the residuals to the mean
By calculating the R² ratio
By subtracting the variance from the intercept
What is the formula for the Total Sum of Squares (TSS)?
TSS = ⋅i=1∑n(yi − y)2
TSS = i=1∑n(yi − y^i)2
TSS = RSSESS
TSS = α + βX
What does the Explained Sum of Squares (ESS) represent?
The sum of squared values of ŷ around the sample mean of y
The difference between actual and predicted values
The total number of independent variables
The square root of the variance
What is the fundamental relationship between TSS, ESS, and RSS?
TSS = ESS - RSS
TSS = ESS + RSS
ESS = TSS + RSS
RSS = ESS + TSS
Which term represents the difference between actual and predicted values (yᵢ - ŷᵢ)?
Intercept (a)
Residual (eᵢ)
Slope (b)
Correlation (ρ)
What effect does a higher sample size have on regression results?
It makes the standard error higher
It makes the t-statistic higher, making it more likely to reject the null
It has no effect on the t-statistic
It makes the R² value zero
How is the R² of a regression defined?
The ratio of ESS to TSS
The ratio of RSS to TSS
1 + TSSESS
ESS × RSS
If a regression model has a higher R² compared to another, what does it indicate?
The model has more errors
The model gives a better fit to the data
The model has fewer observations
The model is unbiased
What is the purpose of the Adjusted R²?
To increase the R² value automatically
To penalize the addition of extra independent variables
To ignore the number of observations (n)
To eliminate autocorrelation
What is the formula for Adjusted R²?
R² = 1 - (RSS / (n - k)) / (TSS / (n - 1))
R² = ESS / TSS
R² = 1 - (RSS / TSS)
R² = α + βX + ε
To achieve unbiased results, what is the technical assumption for x variables?
They must be perfectly correlated with errors
They are not correlated with the error term (ε, e or u)
They must be equal to the mean
They must be categorical
Since we cannot observe the true error term (ε), what do we use for testing?
The population mean
The residuals
The intercept only
The maximum range value
Based on the provided lecture formula, how is the t-statistic calculated?
t = β / se(b) (Coefficient / Standard Error)
t = se(b) / β
t = ESS / TSS
t = RSS / (n - k)
In the example results provided, what does an R² of 0.1513 signify?
The model is 15.13% incorrect
The model explains 15% of the variance in the dependent variable
There are 15 independent variables
The t-statistic for the intercept is 15.13

