
Font size
 Worksheets
Does GDP Tell the Right Story? — Background Essay Worksheet
Total questions: 34
Worksheet time: 20mins
Examine the strengths and limitations of GDP as a measure of a country’s economic health, then answer: Does GDP tell the right story?
Yes, GDP fully captures a nation’s economic health and living standards.
No, GDP alone is limited and does not capture the full economic well-being of a nation.
GDP is unrelated to economic conditions and should not be used in comparisons.
GDP per capita always tells the complete story without any need for other indicators.
Document A excerpt: “Much like a satellite in space can survey the weather across an entire continent, so can the GDP give an overall picture of the state of the economy. It enables the President, Congress, and the Federal Reserve to judge whether the economy is contracting or expanding, whether the economy needs a boost or should be reined in a bit, and whether a severe recession or inflation threatens… Without measures of economic aggregates like GDP, policymakers would be adrift in a sea of unorganized data.” Why do the authors compare GDP to a satellite that surveys weather from space?
It pinpoints the exact income of every household
It provides a broad overview of economic conditions across the nation, similar to a satellite’s wide view
It forecasts precise stock market movements
It measures the moral values of society
Samuelson and Nordhaus say there is a possible connection between GDP and a recession. Based on the Document A excerpt above, what is that connection?
Rising GDP typically signals deepening recession
Falling or stagnating GDP can indicate an economy that may be entering or experiencing recession
GDP has no relationship to recessions
GDP only measures inflation, not recession
Samuelson and Nordhaus say there is a possible connection between GDP and inflation. What is that connection according to the excerpt?
GDP directly sets prices by law
Rapidly rising GDP might coincide with inflationary pressures that policymakers need to monitor
GDP only rises when inflation is zero
Inflation increases only when GDP falls
What useful information does GDP provide for policymakers such as the President, Congress, and the Federal Reserve according to Document A?
Exact wages for every worker
Whether the economy is contracting or expanding and whether it needs a boost or restraint
Which political party will win elections
The number of satellites in orbit
How does Document A help answer the question, “Does GDP tell the right story?”
It shows GDP is useless for policy
It argues GDP is a valuable beacon that helps steer the economy toward key objectives by summarizing complex data
It claims GDP measures personal happiness directly
It concludes GDP only measures trade with foreign nations
Document B note: The chart reports GDP in purchasing power parity (PPP), comparing how much a hypothetical basket of goods would cost in U.S. dollars across countries. Why would economists use PPP when giving GDP data?
To compare exchange rates only
To adjust for differences in price levels across countries so GDP comparisons reflect real purchasing power
To remove population differences from GDP
To measure only government spending
Document B states the chart does not adjust for inflation over time by reporting “real GDP.” Why does that exaggerate the growth shown in the chart?
Because inflation raises price levels, making nominal GDP larger even if real output has not increased as much
Because inflation lowers wages which reduces GDP
Because inflation makes exchange rates constant
Because inflation eliminates changes in population
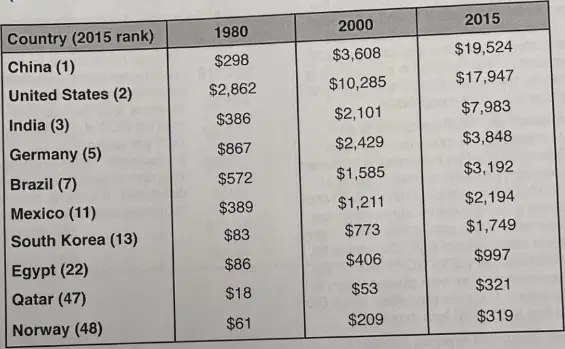
According to the Document B table “GDP for 10 Selected Nations in Billions of Dollars (PPP, not adjusted for inflation),” which nation has the highest GDP in each of the three years shown? Select all correct statements.
1980: United States has the highest GDP ($2,862 billion)
1980: China has the highest GDP ($298 billion)
2000: United States has the highest GDP ($10,285 billion)
2015: China has the highest GDP ($19,524 billion)
2015: United States has the highest GDP ($17,947 billion)
How does Document B help answer the question, “Does GDP tell the right story?”
By showing PPP makes cross-country GDP comparisons more meaningful, but lack of inflation adjustment can mislead about growth over time
By proving GDP cannot be used for any comparison
By showing GDP measures happiness directly
By demonstrating that exchange rates never change
What is the meaning of “GDP per capita” as used in Document C?
Total GDP divided by the population, indicating average output or income per person
Government spending only
Exports minus imports
Total household income

According to the Document C table “GDP per Capita for 10 Selected Nations (PPP, not adjusted for inflation),” which nation has the highest GDP per capita in each year shown and which has the lowest? Select all correct statements.
1980: Highest Qatar ($74,038)
1980: Lowest China ($302)
2000: Highest Qatar ($89,092)
2000: Lowest India ($2,041)
2015: Highest Qatar ($143,788)
Refer to both Document B and Document C. In each chart, what is the world rank of Qatar, and what explains the difference in those rankings?
Total GDP rank 47 and GDP per capita rank 1; Qatar’s small population yields high income per person despite modest total GDP
Total GDP rank 1 and GDP per capita rank 47; Qatar’s large population lowers income per person
Both charts rank Qatar 1 because it is the richest by every measure
Ranks are unknown and unrelated to population
How does Document C help answer the question, “Does GDP tell the right story?”
It shows per capita GDP can reveal living standards that total GDP alone may hide, highlighting the role of population size
It proves GDP is identical to the Human Development Index
It shows GDP only measures government revenue
It suggests PPP is unnecessary
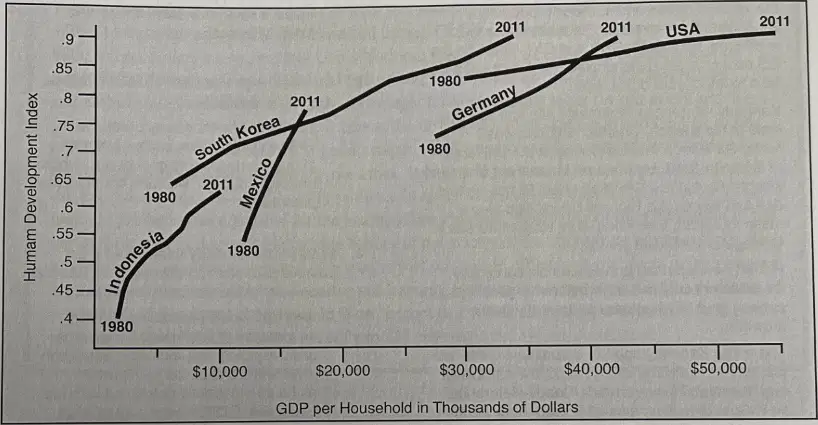
In Document D, what two measures is the graph correlating? (Hint: read the X and Y axes.)
Household GDP (in thousands of dollars) and the Human Development Index (life expectancy/education composite)
Government spending and inflation
Population and unemployment
Exports and imports
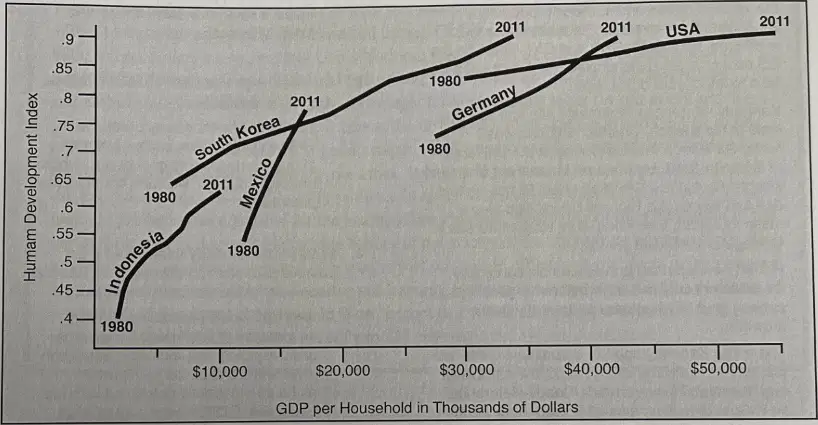
Between 1980 and 2011, what was the relationship between household GDP and the Human Development Index for the United States in Document D?
Negative correlation: as household GDP rose, HDI fell
Positive correlation: increases in household GDP were associated with higher HDI
No correlation at all
GDP fell while HDI rose
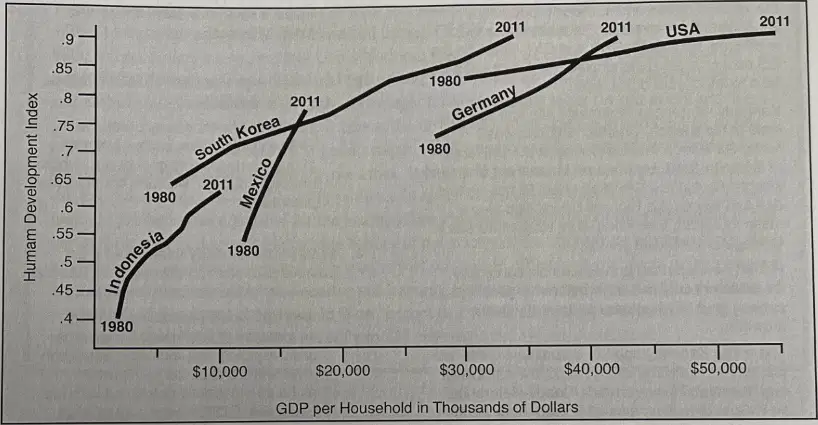
Between 1980 and 2011, what was the correlation between household GDP and the Human Development Index for Indonesia in Document D?
Positive correlation: as household GDP increased, HDI also rose
Negative correlation: HDI decreased as GDP grew
No change in either measure
Correlation cannot be determined from the graph

What generalization can you make about the correlation between household GDP and life expectancy/education in all five countries shown in Document D?
Higher household GDP tends to be associated with higher Human Development Index
Higher household GDP tends to be associated with lower Human Development Index
There is no consistent relationship across countries
HDI determines GDP but not vice versa

How does Document D help answer the question, “Does GDP tell the right story?”
It suggests GDP relates to human development outcomes, implying GDP can be informative when connected to life expectancy and education
It proves GDP measures personal happiness directly
It shows GDP has no relationship to life expectancy or education
It argues GDP only measures military spending
According to Robert F. Kennedy’s 1968 speech excerpt in Document E, what was the United States’ gross national product in 1968?
About $80 billion per year
Over $800 billion per year
Approximately $8 trillion per year
Less than $100 billion per year
Which items does GNP include, according to RFK’s Document E excerpt? Select all that apply.
Pollution and cigarette advertising
Costs of clearing highways of carnage with ambulances
Special locks for doors and jails for people who break them
The beauty of our poetry
Napalm, nuclear warheads, and armored cars
Which items does GNP not include, according to RFK’s Document E excerpt? Select all that apply.
The health of our children and the quality of their education
The joy of their play and the beauty of our poetry
The strength of our marriages and the integrity of our public officials
Violent television programs that glorify violence to sell toys
Compassion and devotion to our country
Based on Document E, what might Robert Kennedy think about the positive relationship between GDP and the happiness index shown in Document D?
He would see GDP as a complete measure of happiness
He would argue GDP misses many values that make life worthwhile, so a simple positive correlation may not tell the whole story
He would say happiness is determined only by military spending
He would claim GDP and happiness are unrelated because data are impossible to collect
How does Document E help answer the question, “Does GDP tell the right story?”
It critiques GDP/GNP for measuring material output while excluding many aspects of well-being, suggesting GDP alone may not tell the full story
It shows GDP perfectly captures national virtue and happiness
It proves GDP should be replaced by exchange rates
It argues GDP measures only population size

Document F: Index of Social Health in US. The page includes two lists labeled Progress Made (infant mortality; high school dropouts; teenage drug abuse; poverty, ages 65+; homicides; drunk driving deaths; affordable housing) and Lack of Progress Made (child poverty; child abuse; teenage suicide; unemployment; weekly wages; health insurance coverage; health-care costs; food insecurity; income inequality). A line graph titled Index of US Social Health shows values from 1970 to 2011 trending downward and then flat. A second line graph titled Real US GDP, in Trillions of Dollars shows steady growth from 1970 to 2011. What does the Social Health Index measure?
A composite of measures of the nation’s social well-being since 1970
The total market value of goods and services produced in the economy
Population growth and migration in the United States
Performance of US stock markets over time
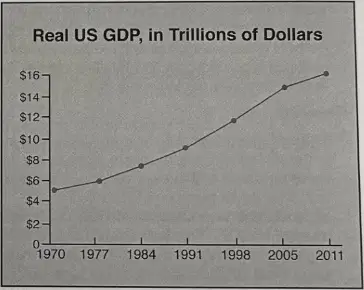
Document F: A line graph titled Real US GDP, in Trillions of Dollars (1970–2011) shows a steady rise in values. What does the real GDP graph measure?
Inflation-adjusted total value of goods and services produced in the US economy, shown in trillions of dollars
Nominal GDP without adjusting for changes in prices
The nation’s Social Health Index score over time
The unemployment rate by year

Document F: Considering the Index of US Social Health line graph (declining and then flat from 1970–2011) and the Real US GDP line graph (rising from 1970–2011), what generalization best describes their relationship during this period?
Real GDP increased while the Social Health Index declined or remained flat
Both the Social Health Index and real GDP increased together
Both the Social Health Index and real GDP decreased together
Neither the Social Health Index nor real GDP changed

Document F: Based on the two graphs and the lists of social indicators, how does this document help answer the question, “Does GDP tell the right story?”
It shows GDP growth does not necessarily indicate improvements in social well-being
It proves GDP fully captures all aspects of social health
It shows GDP and social health always move in the same direction
It shows GDP decreased while social health improved

Document G: Photos and data about the Deepwater Horizon oil spill (April 20, 2010) show an offshore drilling unit explosion, oil gushing into the Gulf of Mexico, wildlife covered in oil, and cleanup efforts. Which summary best describes the photo series?
An offshore drilling explosion leading to a massive oil spill, wildlife harm, and cleanup operations
A hurricane making landfall and causing coastal flooding
A volcanic eruption impacting a coastal community
A forest fire progressing from ignition to controlled burn
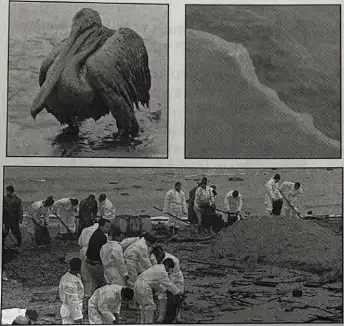
Document G: Economists call the spill’s harms “negative externalities,” undesirable consequences not counted in GDP. Which specific negative externalities are suggested by the photos and text on the page? Select all that apply.
Wildlife deaths and habitat destruction along the Gulf Coast
Contamination of thousands of miles of coastline and ecosystem damage
Cleanup expenditures that add to measured economic activity
Increases in fishing and tourism revenues

Document G: Which of the listed figures would be included in GDP totals?
$18.7 billion spent by BP on cleanup efforts
$23 billion in lost revenue to the Gulf Coast tourist industry
$2.5 billion in losses to the US fishing industry
Between 27,000 and 65,000 sea turtles estimated to have died

Document G: Which of the listed figures would not be included in GDP totals? Select all that apply.
$23 billion in losses to the Gulf Coast tourist industry
$2.5 billion in losses to the US fishing industry
$18.7 billion in fines/settlement payments by BP
$18.7 billion spent by BP on cleanup efforts

Document G: How does this document help answer the question, “Does GDP tell the right story?”
It shows GDP can rise from cleanup spending even while severe environmental damage occurs
It shows GDP fully accounts for environmental harm to ecosystems and wildlife
It shows disasters have no economic impact and therefore do not affect GDP
It shows GDP directly measures the health of marine environments
Is GDP an accurate measurement of a countries wealth?
(2 paragraphs)

