
Font size
 Worksheets
Page 1
Total questions: 150
Worksheet time: 1hrs 15mins
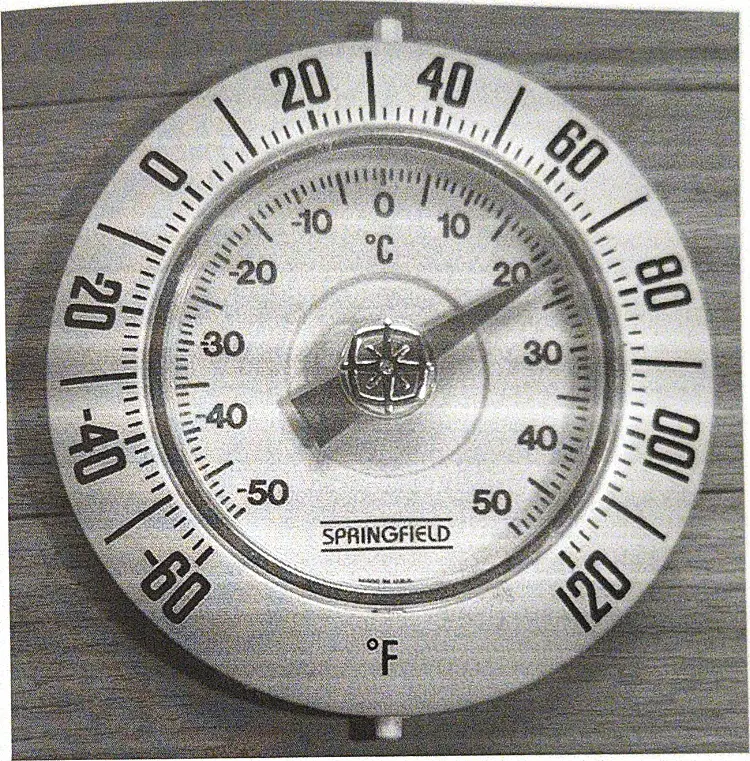
Look at the thermometer image with both Fahrenheit and Celsius scales. What Celsius temperature is indicated by the pointer near 72°F?
0°C
32°C
22°C
-10°C
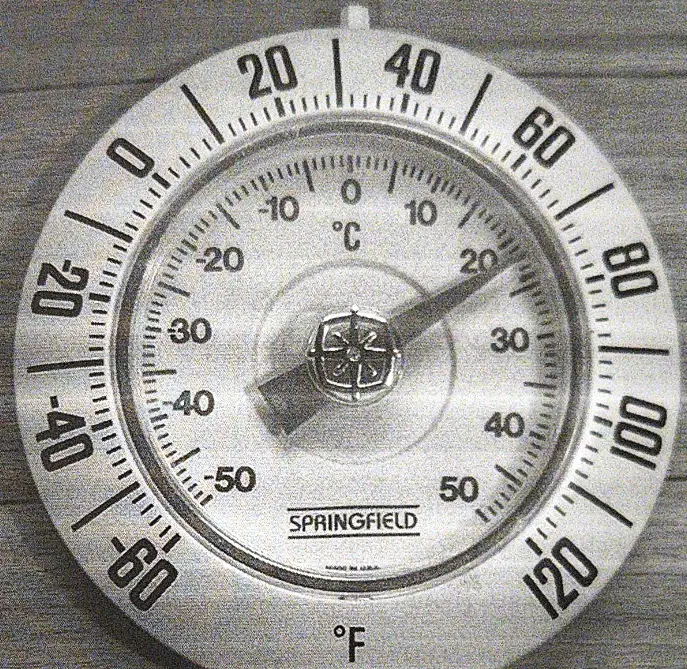
A storage requirement lists -20°F. Which Celsius value is closest to this temperature using the dual-scale thermometer concept and conversion knowledge?
-19°C
-39°C
-32°C
-29°C

On the inner Celsius scale, what temperature corresponds to the freezing point of water?
20°C
0°C
-10°C
10°C
Which statement best describes the relationship between 0°F and temperatures on the Celsius scale?
It is well below 0°C
It equals exactly 0°C
It is slightly above 0°C
It equals 10°C
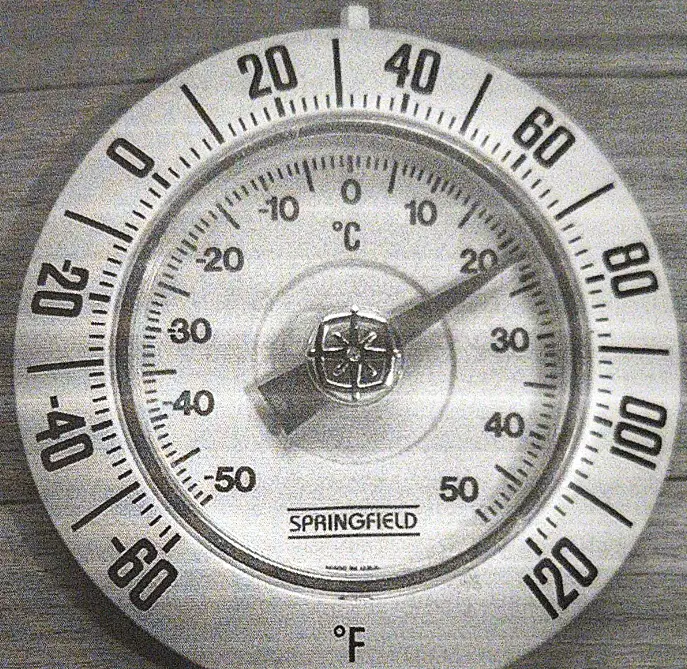
If the pointer moves from 70°F to 80°F, about how many degrees does it move on the Celsius scale?
About 2°C
About 6°C
About 12°C
About 20°C
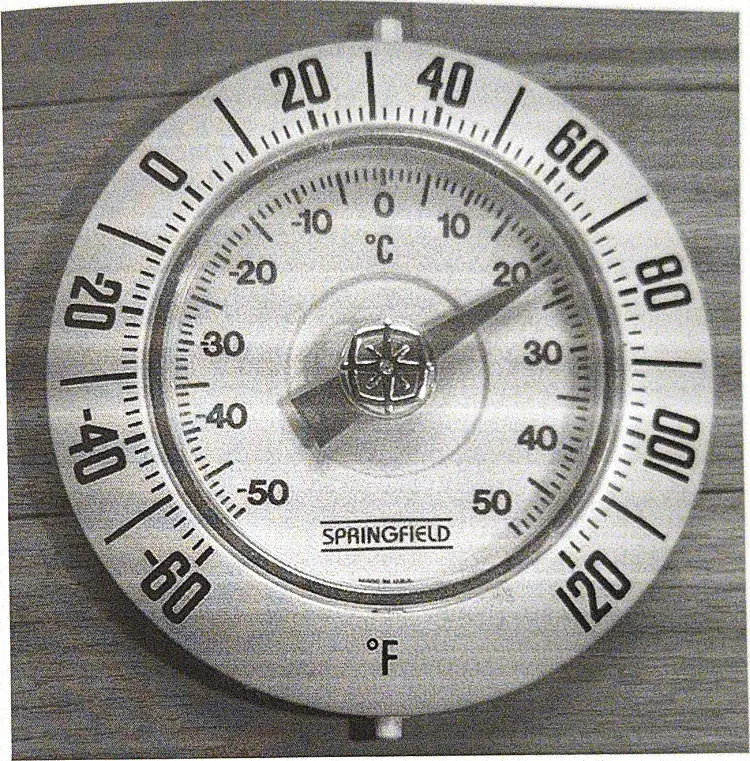
Which reading is warmer: 25°C or 68°F?
25°C is warmer
68°F is warmer
Cannot be compared
They are exactly equal
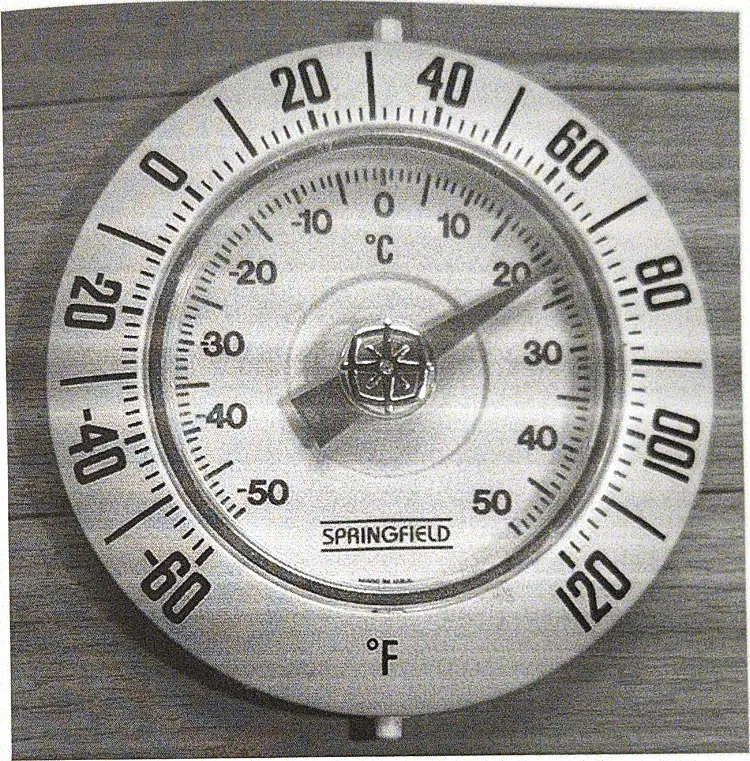
A classroom thermostat shows 18°C. Which Fahrenheit value is closest?
64°F
72°F
86°F
54°F
When reading an analog dial, why might the Fahrenheit and Celsius scales appear not to match perfectly?
Photograph angle causes parallax
The thermometer is broken
Fahrenheit and Celsius change randomly
Celsius is twice Fahrenheit
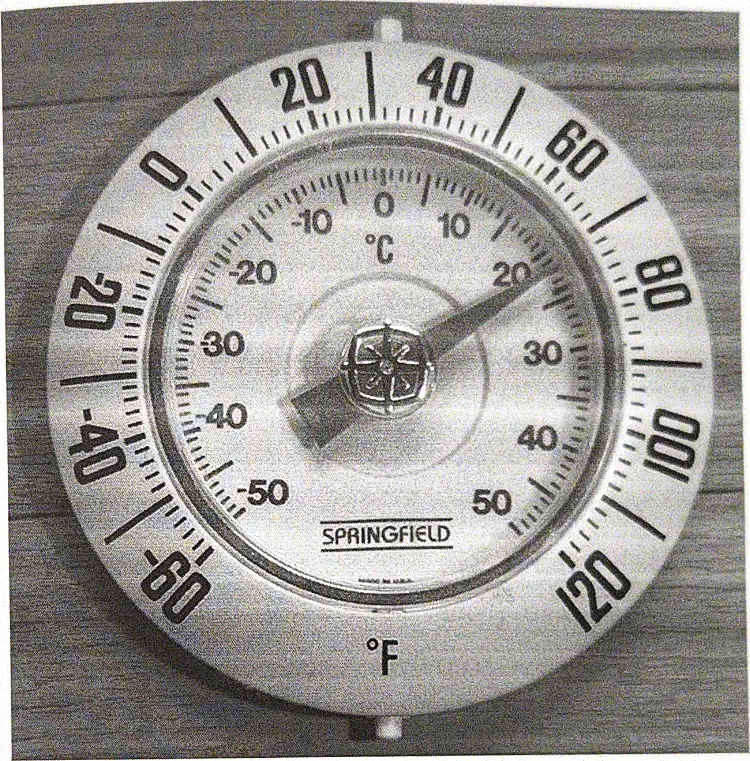
Which is the best estimate for room temperature on the Celsius scale when the dial shows around 70°F?
21°C
-5°C
35°C
5°C
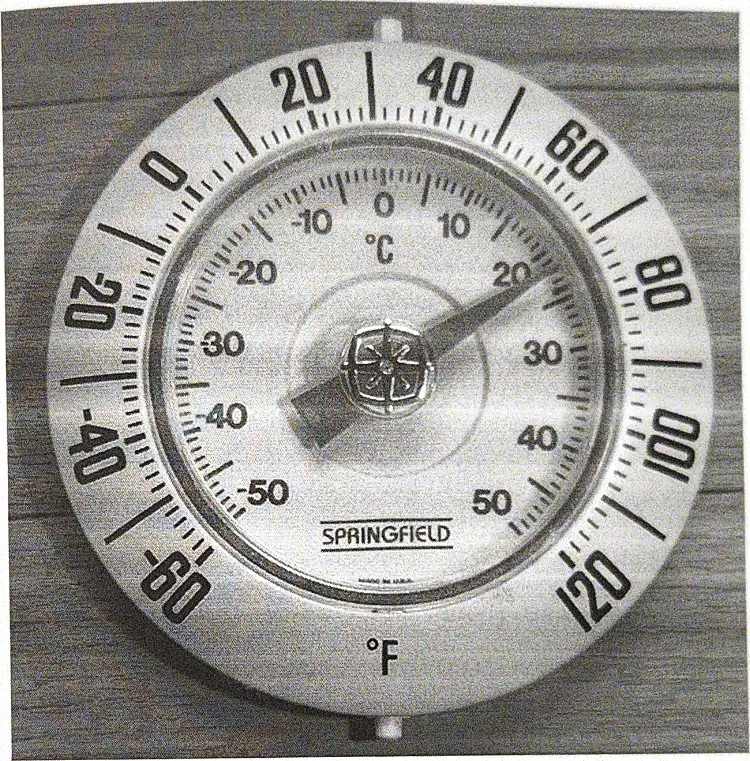
A sample must be kept at 0°C. What Fahrenheit temperature should you set on a dial that only shows °F?
32°F
0°F
50°F
10°F

According to the pie chart, which category has the highest percentage of violations?
Hazardous materials at 8 percent
Fire protection at 7 percent
Toxic and hazardous substances at 23 percent
Electrical standards at 21 percent

Which time span does the dataset cover for the violations shown?
From January 1994 to December 2004
From January 1996 to December 2002
From January 1990 to December 2000
From January 1995 to December 2003

Which category is labeled at 10 percent on the chart?
Personal protective equipment
Machinery and machine guarding
All other categories
Walking-working surfaces

Identify the percentage shown for Walking–Working Surfaces.
Ten percent
Eight percent
Seven percent
Nine percent

Which category has the smallest percentage among the labeled slices?
Personal protective equipment at eight percent
Hazardous materials at eight percent
Electrical at twenty-one percent
Fire protection at seven percent

What percentage is assigned to "All Other" on the chart?
Ten percent
Twenty-three percent
Seventeen percent
Nine percent

Which two categories are both shown as eight percent?
Machinery guarding and walking surfaces
All other and electrical
Electrical and fire protection
Hazardous materials and personal protective equipment

If you combine Electrical (21%) and Machinery & Machine Guarding (10%), what total percentage do they represent?
Thirty-three percent
Thirty percent
Thirty-one percent
Twenty-nine percent

Which category is most likely to be second-highest after Toxic & Hazardous Substances?
Electrical at twenty-one percent
All Other at seventeen percent
Machinery guarding at ten percent
Walking surfaces at nine percent
The prompt on the page asks: Which type of standards were most frequently violated during the given time period? Choose the correct option.
Other
Hazardous materials
Fire protection
Electrical
The page also asks: This data was collected over a period of approximately how many years? Choose the correct option.
Sixteen years
Eleven years
Six years
Twenty years

Using the image with the cartridge beside a metric ruler, what is the approximate length of the cartridge?
About 4 inches
About 2.5 inches
About 4 centimeters
About 2.5 centimeters

The ruler in the image is labeled in centimeters. Which mark indicates 3 centimeters from zero?
The fourth long tick
The third long tick
The first long tick
The second long tick

Which comparison best estimates the cartridge length relative to the coin?
About three times the coin diameter
About twice the coin diameter
About the same as the coin diameter
About half the coin diameter

If the cartridge measures near 4 cm, what is this length in millimeters?
About 400 millimeters
About 4 millimeters
About 40 millimeters
About 25 millimeters

The zero mark on the ruler aligns with the cartridge base. Why is this important for measurement accuracy?
It reduces parallax error
It ensures consistent lighting
It magnifies the scale
It keeps temperature constant
Which unit is most appropriate for reporting the cartridge length shown?
Millimeters
Micrometers
Meters
Kilometers
If the ruler had inches instead of centimeters, which estimate would be closest for the cartridge length?
About 1 inch
About 1.5 inches
About 2 inches
About 3 inches

Which statement best explains why '2.5 centimeters' is not a good estimate for the cartridge length?
The tip is too sharp
The base is too wide
The top exceeds the 3 cm mark
The ruler uses inches

If the coin’s diameter is about 2.4 cm, what ratio of cartridge length to coin diameter is most reasonable?
About 4:1
About 1:1
About 2:1
About 3:1

To improve precision, which method should be used when reading the ruler in the image?
Round to the nearest full inch
Estimate to the nearest half centimeter
Measure from the coin’s edge
Ignore the zero alignment
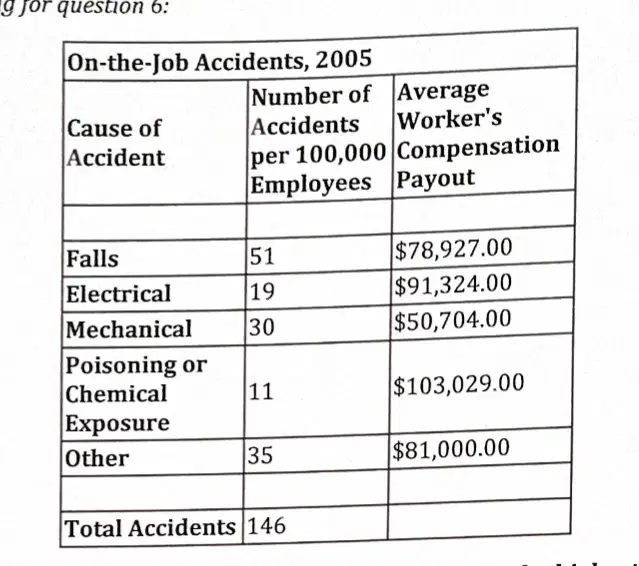
Which cause of on-the-job accidents shows the highest average worker’s compensation payout in the table?
Poisoning or chemical exposure has the highest payout
Electrical has the highest payout listed
Mechanical has the highest payout listed
Falls have the highest payout listed
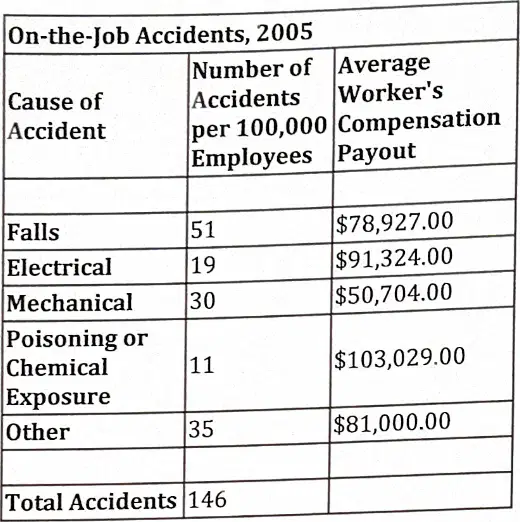
According to the table, which cause has the greatest number of accidents per 100,000 employees?
Electrical shows the greatest accident count
Other shows the greatest accident count
Mechanical shows the greatest accident count
Falls show the greatest accident count
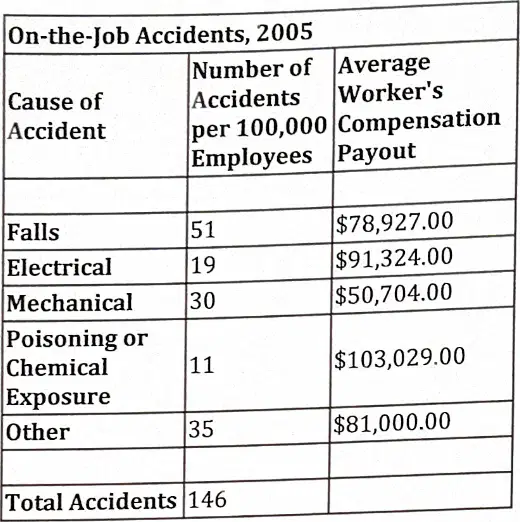
Which accident cause has the lowest average compensation payout?
Falls have the lowest payout amount
Electrical has the lowest payout amount
Other has the lowest payout amount
Mechanical has the lowest payout amount
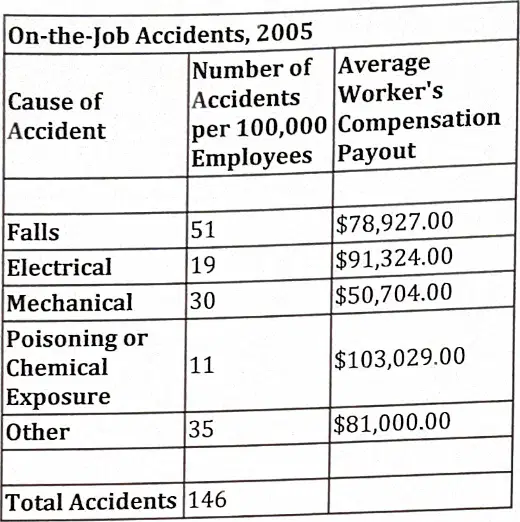
What is the total number of accidents per 100,000 employees shown at the bottom of the table?
The total listed is 166
The total listed is 156
The total listed is 146
The total listed is 136
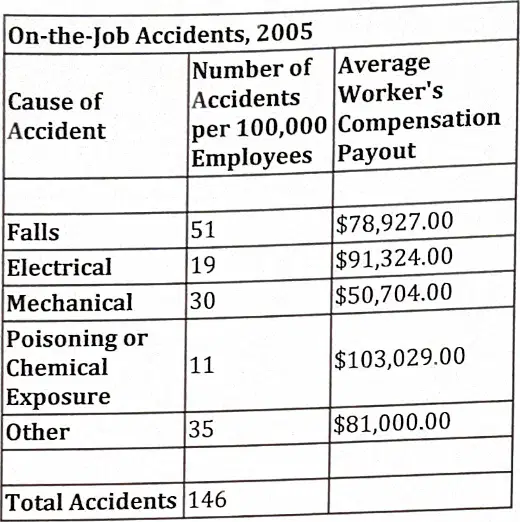
Which cause has an average payout closest to $81,000?
Other is closest to $81,000
Falls are closest to $81,000
Electrical is closest to $81,000
Mechanical is closest to $81,000
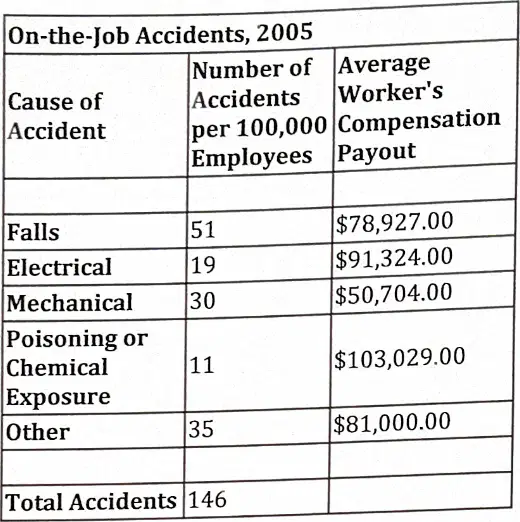
If you rank causes by average payout from highest to lowest, which comes second?
Other comes second in payout rank
Electrical comes second in payout rank
Falls comes second in payout rank
Mechanical comes second in payout rank
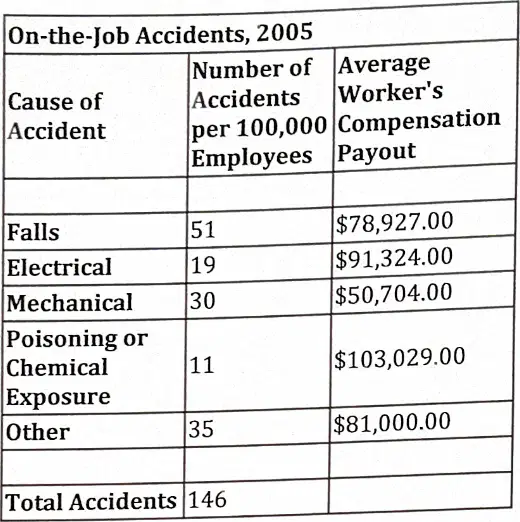
Which statement about the relationship between accident frequency and payout is best supported by the table?
Payouts do not vary between causes
Frequency and payout are identical measures
Less frequent accidents often pay more
More frequent accidents always pay more
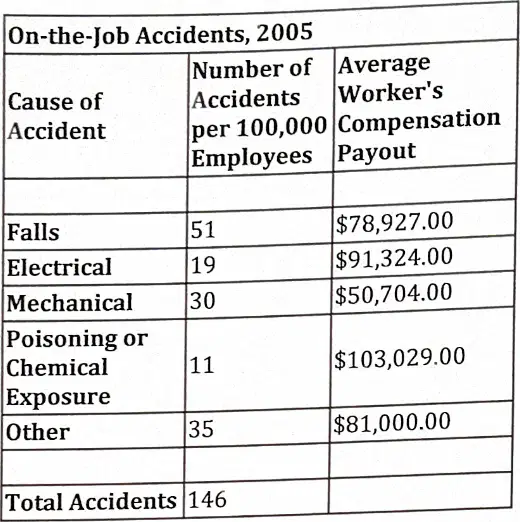
A company wants to reduce payouts. Targeting which cause may have the biggest payout per incident impact?
Electrical should be targeted first
Poisoning or chemical exposure should be targeted
Falls should be targeted first
Mechanical should be targeted first

If ‘Other’ accidents decrease by 5 cases, what would the new total accidents be?
The new total would be 142
The new total would be 141
The new total would be 144
The new total would be 143
Which pair shows a cause with fewer accidents but higher average payout than Falls?
All causes compared to Falls
Electrical compared to Falls
Mechanical compared to Falls
Other compared to Falls
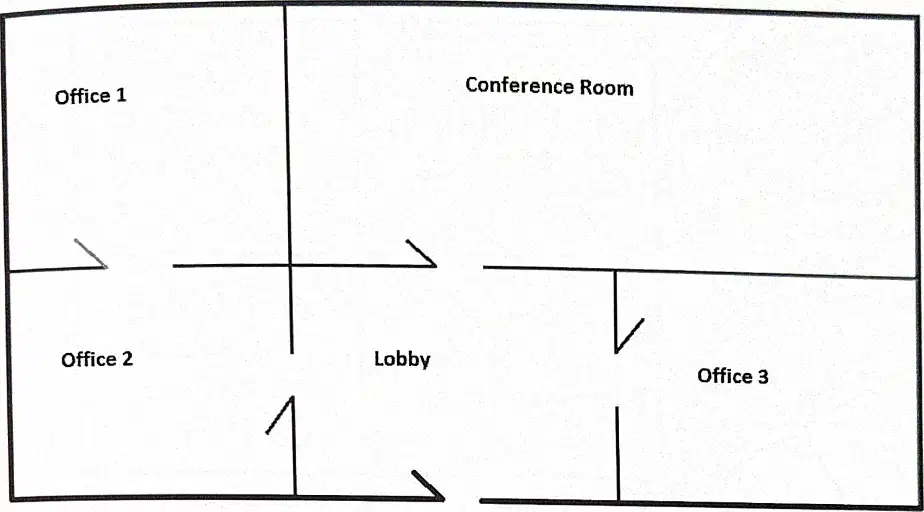
Look at the floor plan. Which room appears to have the greatest area based on relative dimensions?
Office 3 on the right side
The conference room on the top
The lobby space in the center
Office 1 on the left side
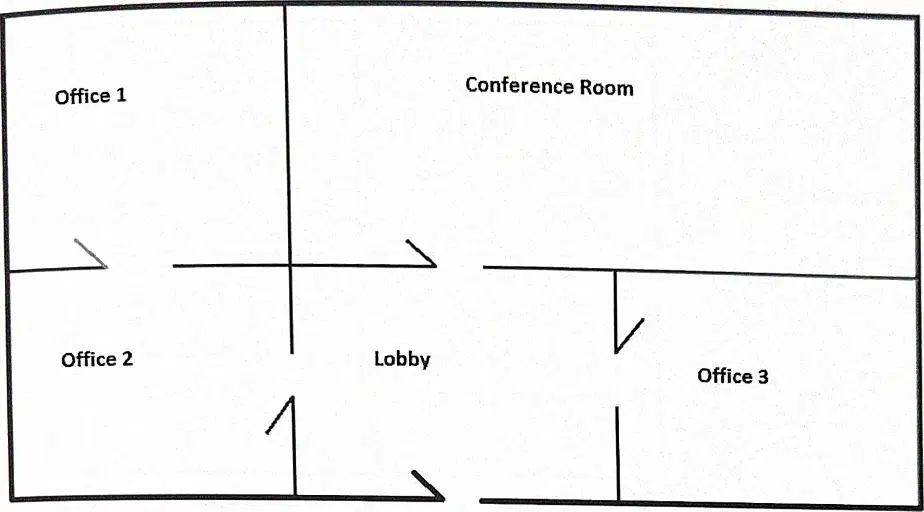
Which labeled room is directly below Office 1 in the floor plan?
The lobby area
Office 2 section
Office 3 section
Conference room area
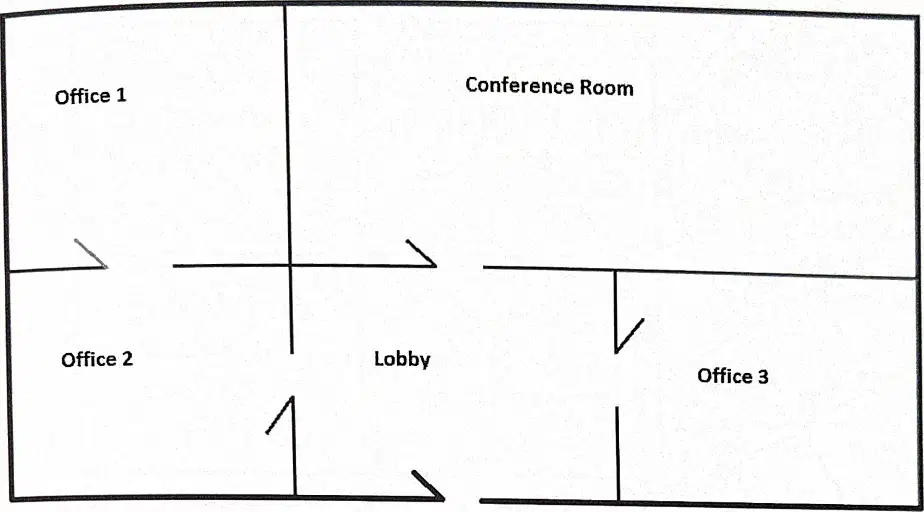
Which room has an entrance opening toward the lobby from the right side of the plan?
Conference room entry top center
Office 1 entry from left
Office 2 entry from lobby
Office 3 entry near lobby
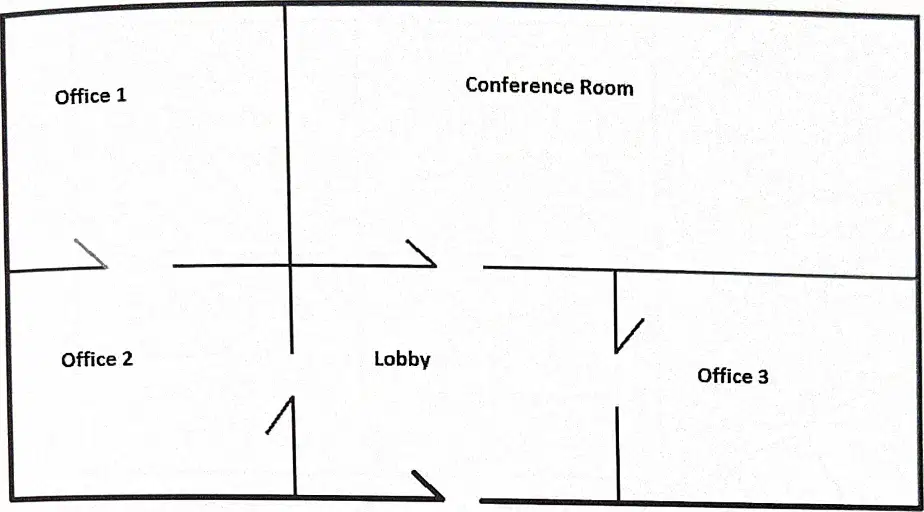
Which space is centrally located and connects to multiple rooms?
The right office
The left office
The top conference
The central lobby
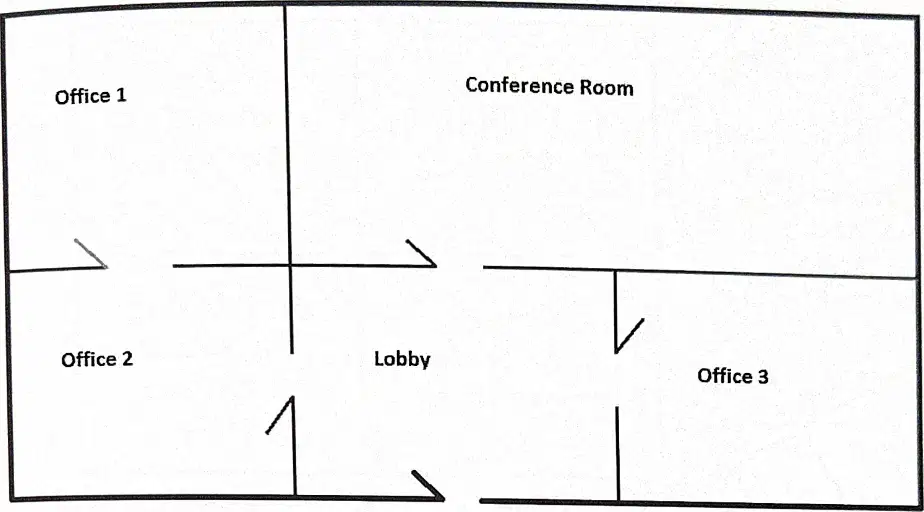
If walls divide the suite into rectangular sections, which room is the largest rectangle?
The lobby rectangle
Office 1 rectangle
Office 3 rectangle
Conference room rectangle
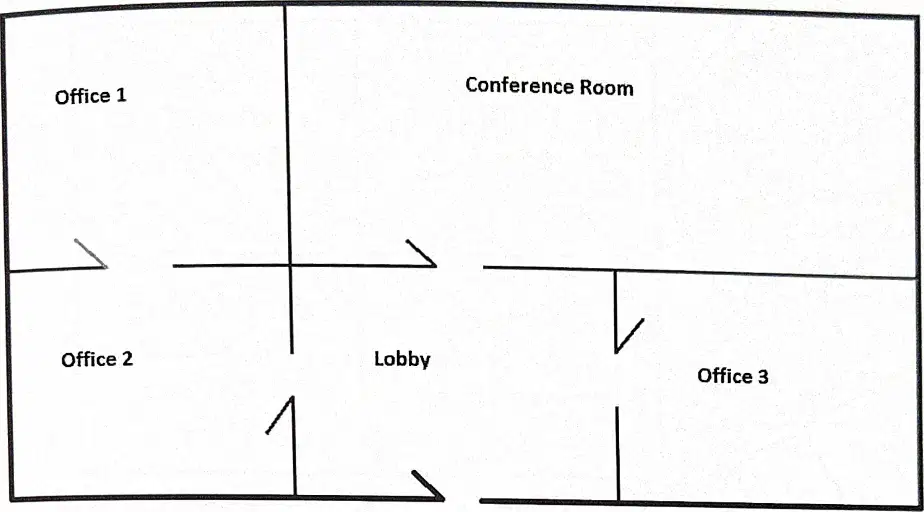
Which pair of rooms are positioned on the left side of the suite?
Conference and Office 3
Lobby and Conference
Office 1 and Office 2
Lobby and Office 3
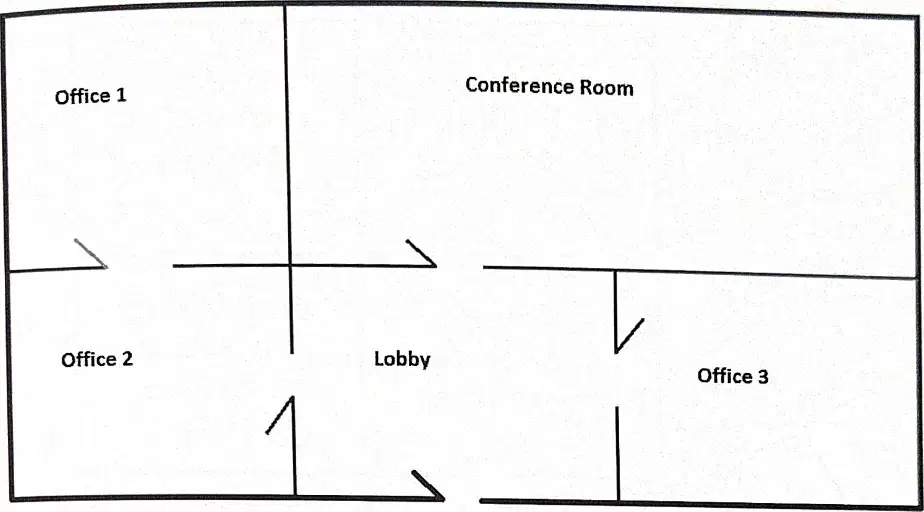
Which room shares a wall with both the lobby and the conference room?
Office 2 section
None of the rooms
Office 1 section
Office 3 section
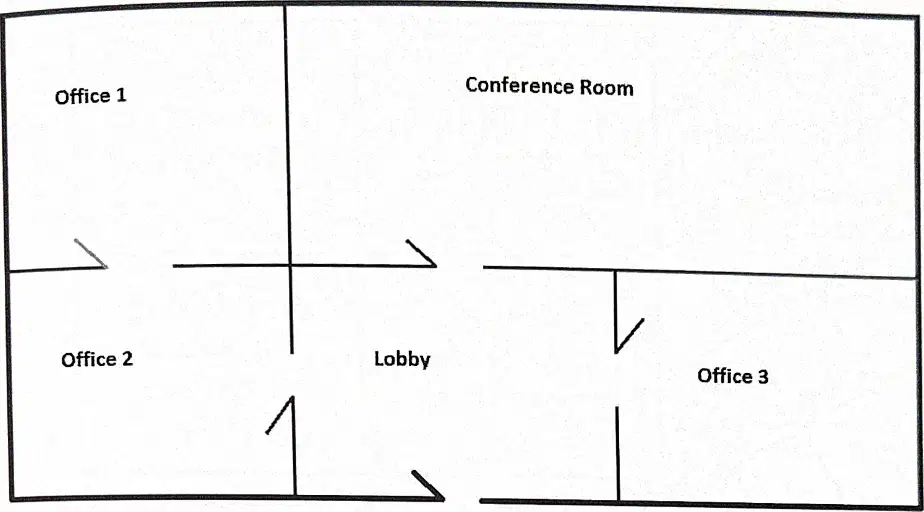
Which direction would you move from the lobby to reach the conference room?
Move diagonally right
Move left from lobby
Move down from lobby
Move up from lobby
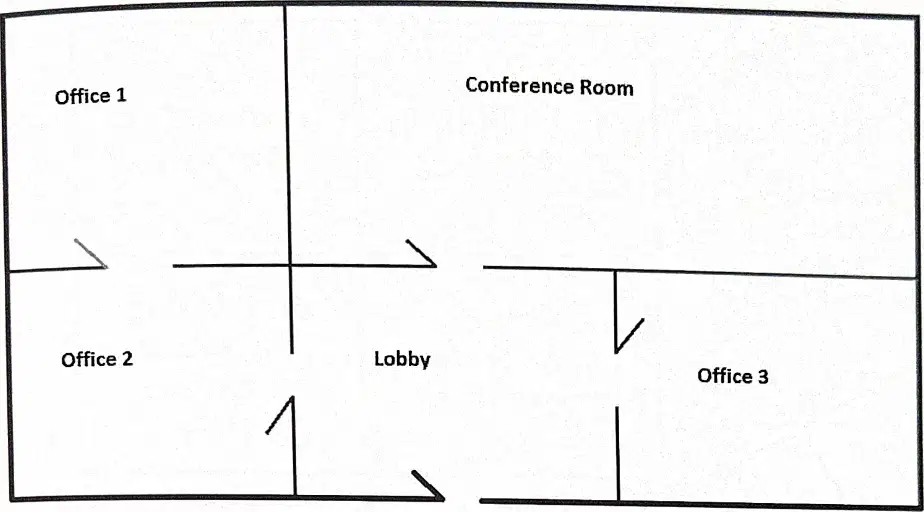
Which room is most likely intended for group meetings based on the labels?
Office 2 workspace
Conference room area
Office 1 workspace
Office 3 workspace
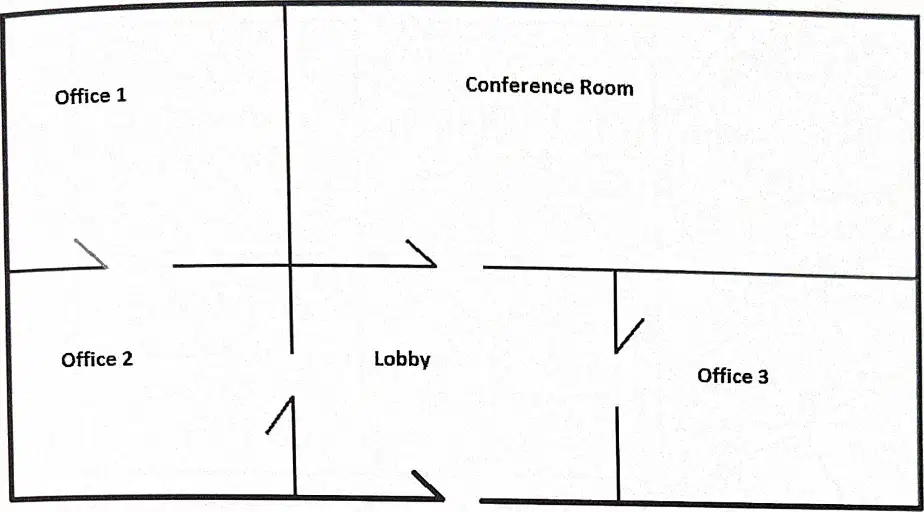
Which room appears smallest by area estimation from the diagram?
Office 3 on the right
The central lobby
Office 2 on the left
Office 1 on the left
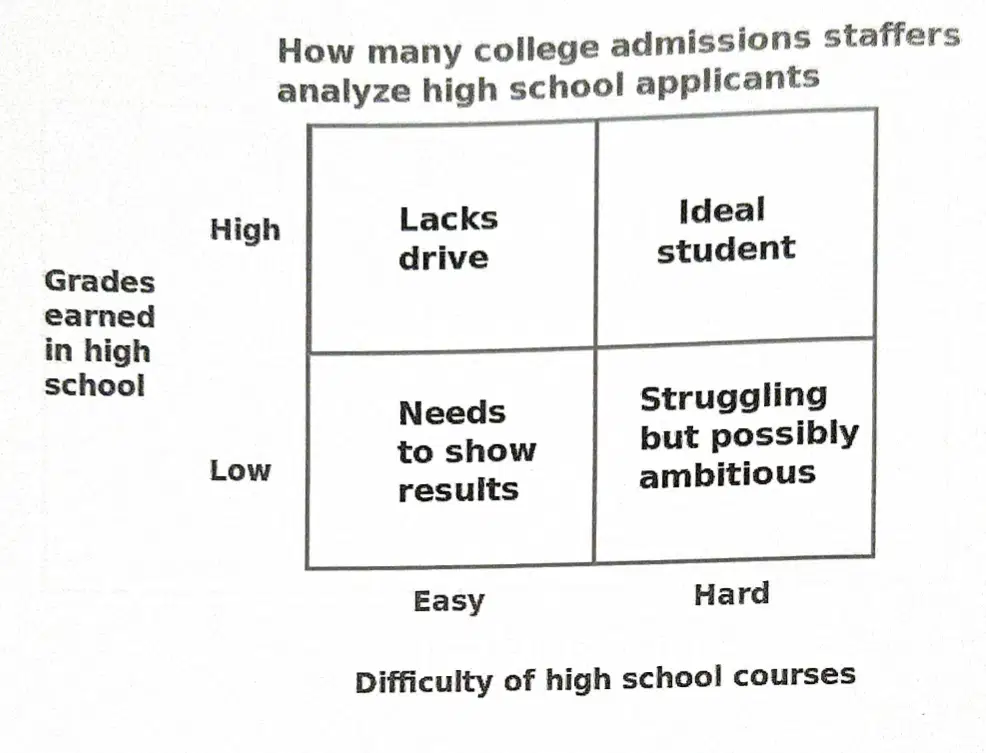
In the chart, what label corresponds to high grades in easy courses?
Struggling but possibly ambitious
Needs to show results
Ideal student
Lacks drive
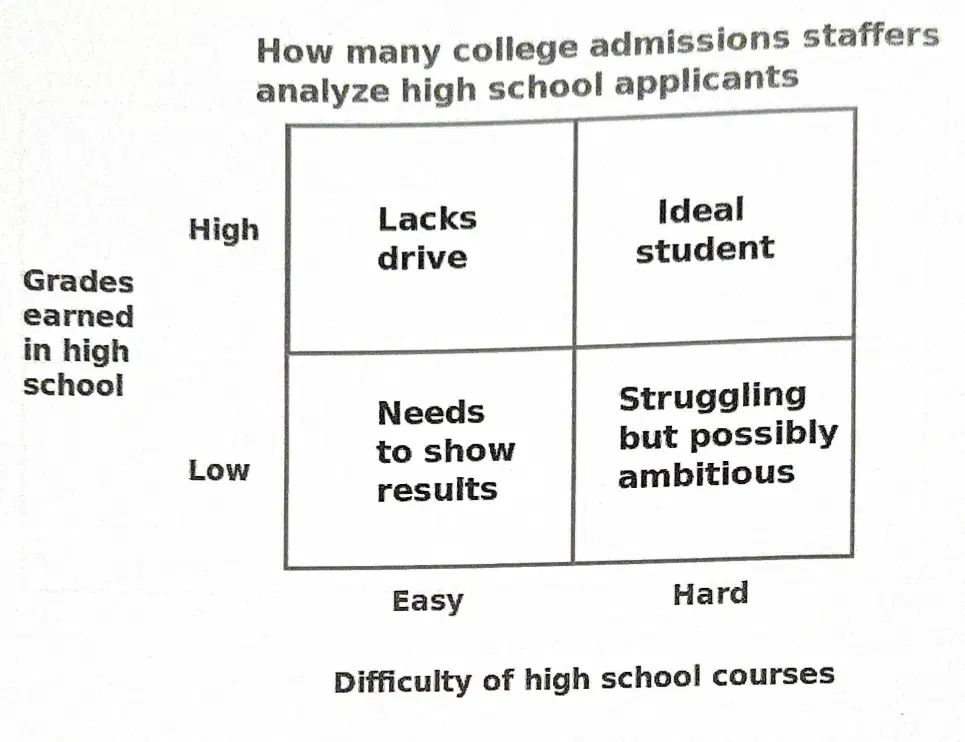
A student with high grades in hard courses matches which category in the matrix?
Struggling but possibly ambitious
Needs to show results
Ideal student
Lacks drive
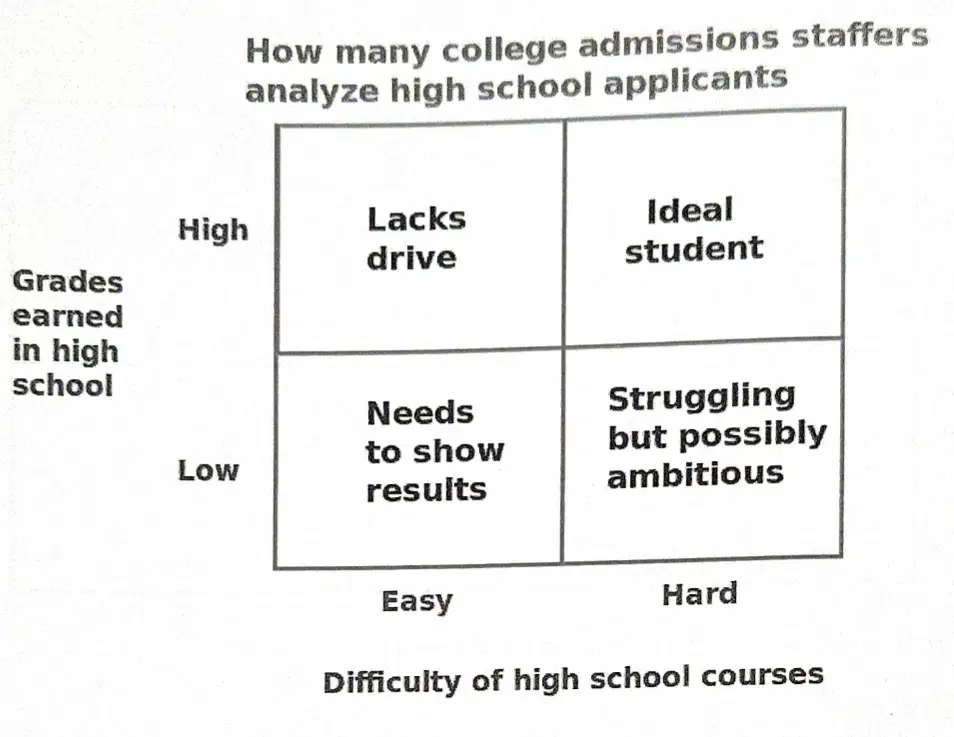
Which category fits low grades in easy courses?
Needs to show results
Ideal student
Struggling but possibly ambitious
Lacks drive
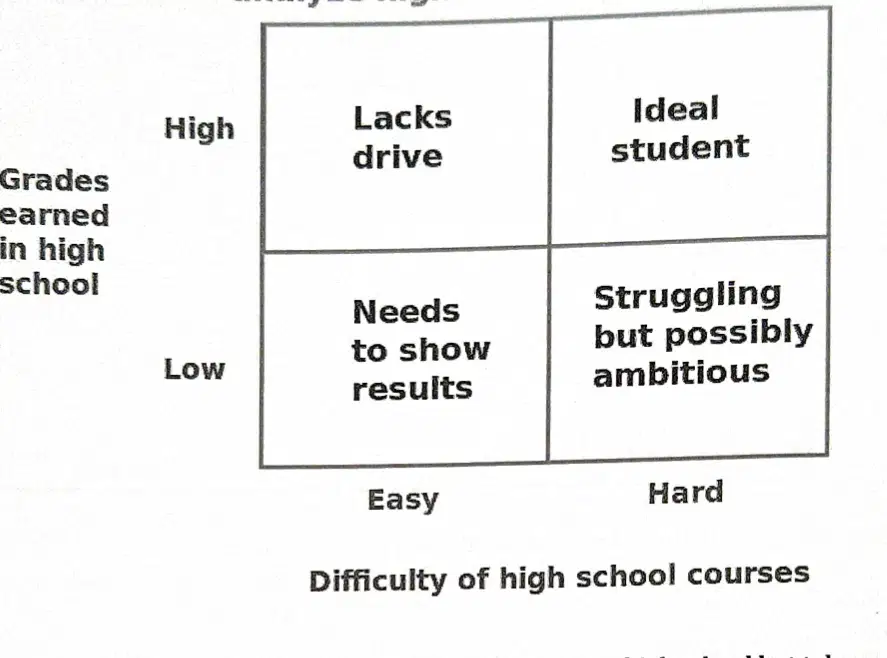
Low grades with hard courses are described as what?
Needs to show results
Ideal student
Lacks drive
Struggling but possibly ambitious
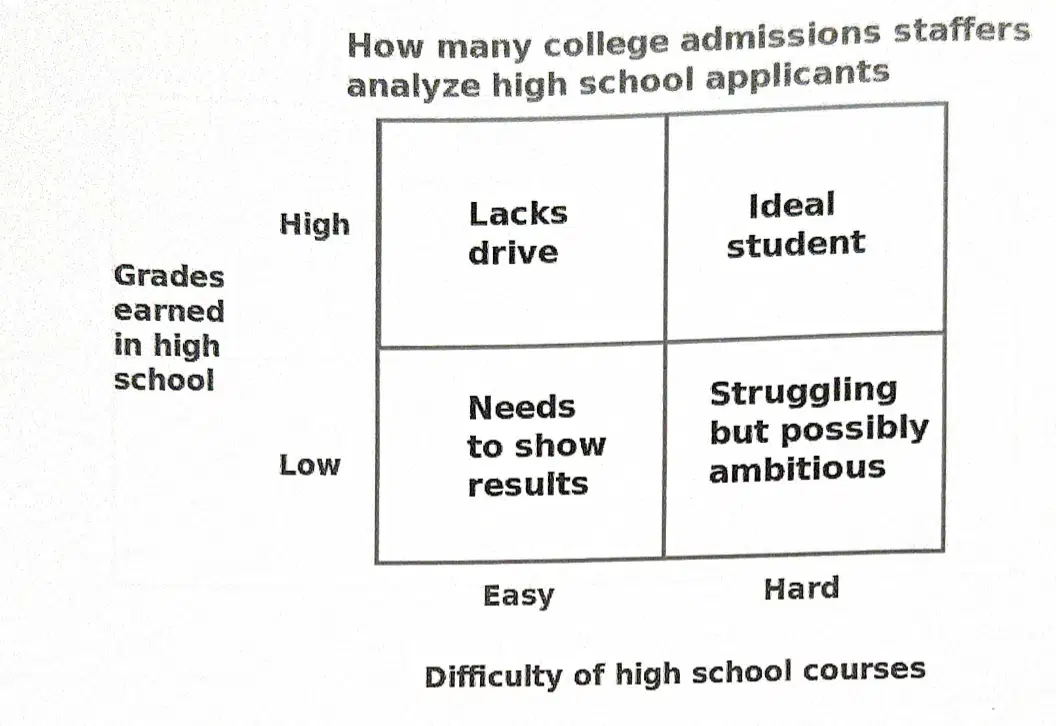
According to the chart, which combination suggests a student may be ambitious despite challenges?
Low grades, easy courses
Low grades, hard courses
High grades, hard courses
High grades, easy courses
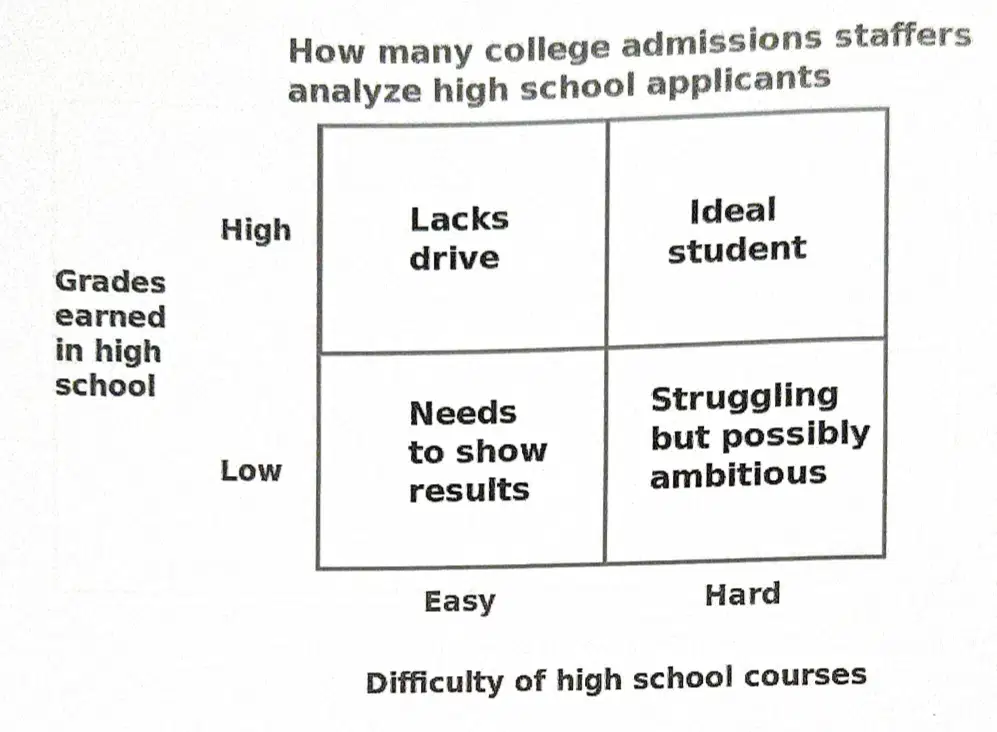
Which matrix axis runs left to right at the bottom?
Student motivation level
Difficulty of high school courses
College acceptance rate
Grades earned in high school
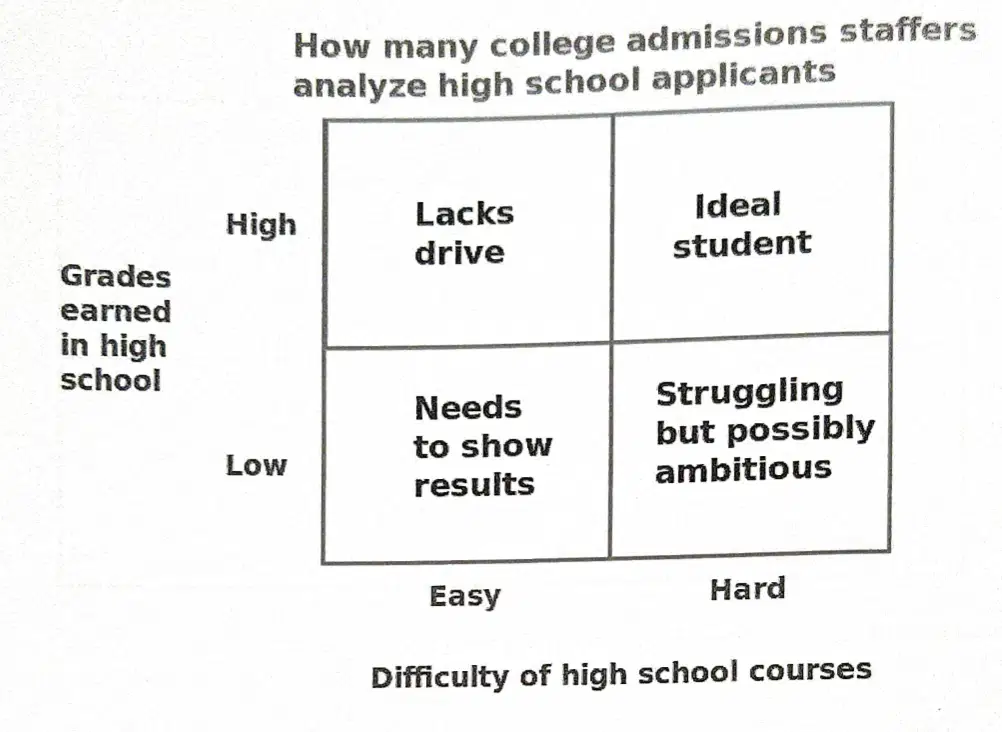
What does the vertical axis of the chart represent?
Admissions decisions
Course difficulty scale
Grades earned in high school
Extracurricular involvement

Which label implies a negative view of motivation despite strong performance?
Possibly ambitious
Lacks drive
Ideal student
Needs to show results
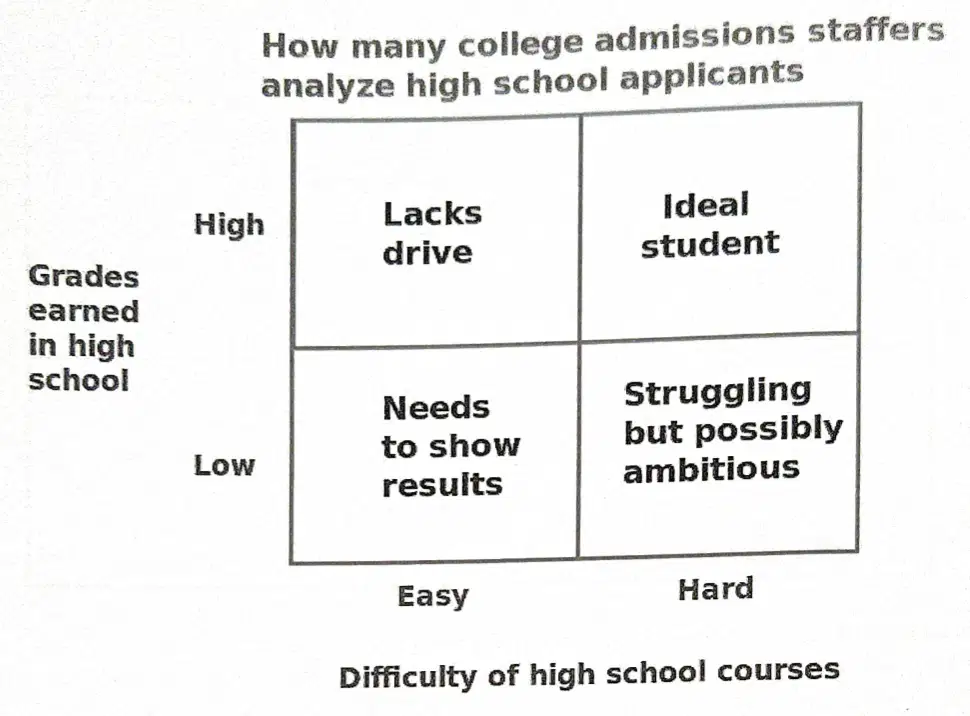
Moving from easy to hard courses with low grades shifts a student from which label to which?
Needs to show results to Struggling but possibly ambitious
Ideal student to Lacks drive
Lacks drive to Ideal student
Struggling to Needs to show results

Which student profile would admissions likely consider most favorable?
High grades in hard courses
Low grades in hard courses
High grades in easy courses
Low grades in easy courses

On the map, which street runs parallel to 3rd Ave across most of the area shown?
Pike St
2nd Ave
1st Ave
Alaskan Way
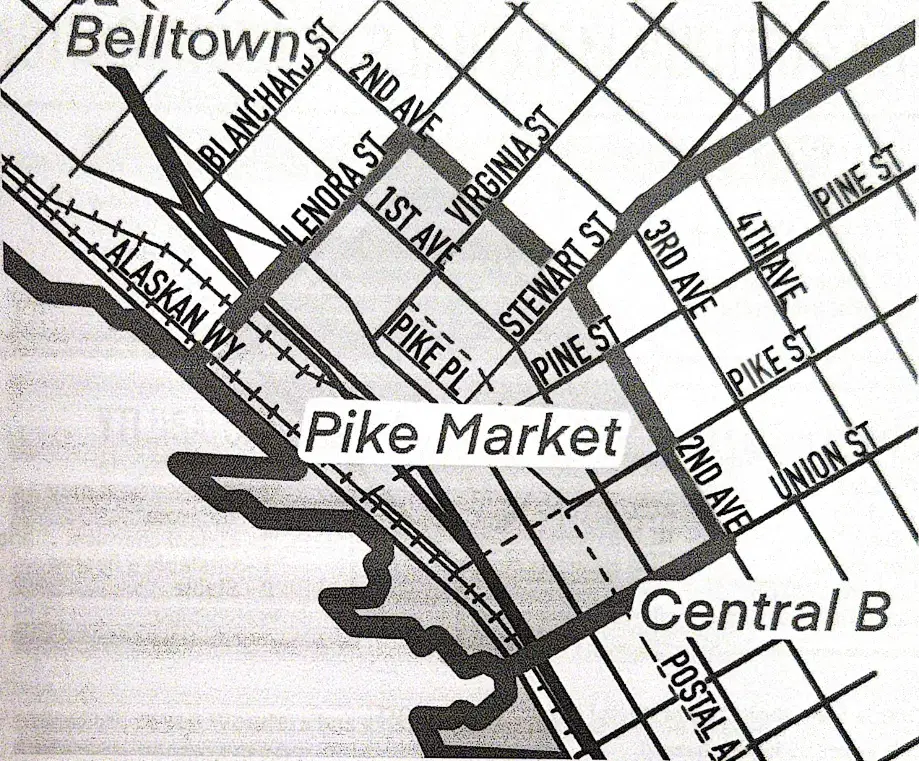
If you start at Pike St and 4th Ave and move one block west and one block south, where do you arrive?
Pine St and 3rd Ave
Pine St and 2nd Ave
Union St and 3rd Ave
Pike Pl and 3rd Ave
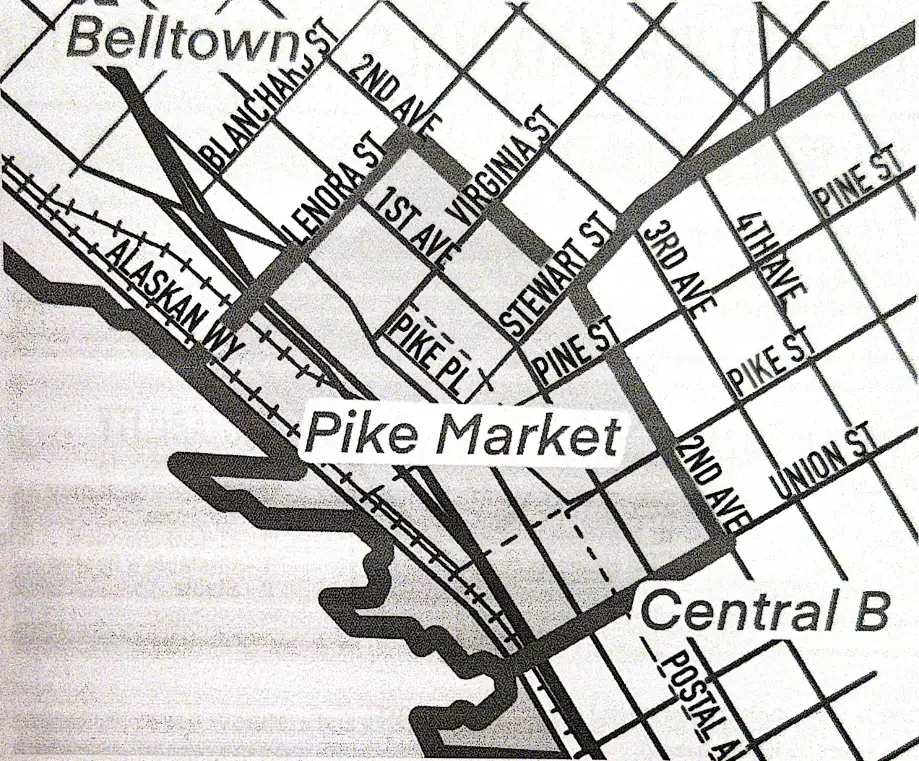
Which labeled neighborhood lies directly northwest of Pike Market on the map?
Central B
Postal Area
Lenora District
Belltown
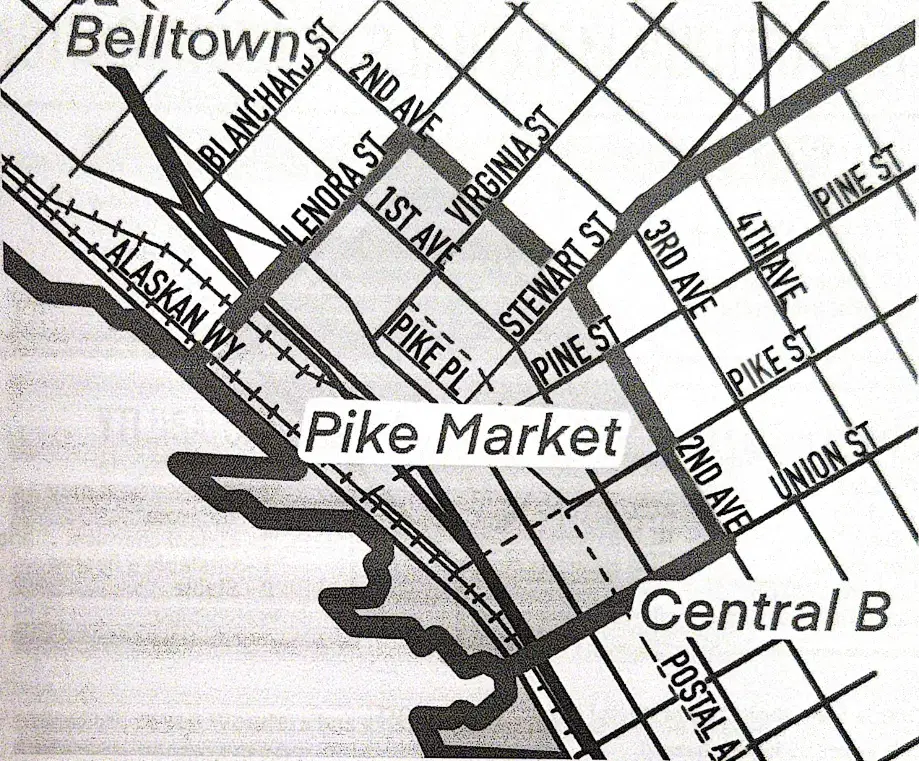
To walk the shortest route from Virginia St to Lenora St, which general direction should you go?
Southwest
Northwest
Northeast
Southeast
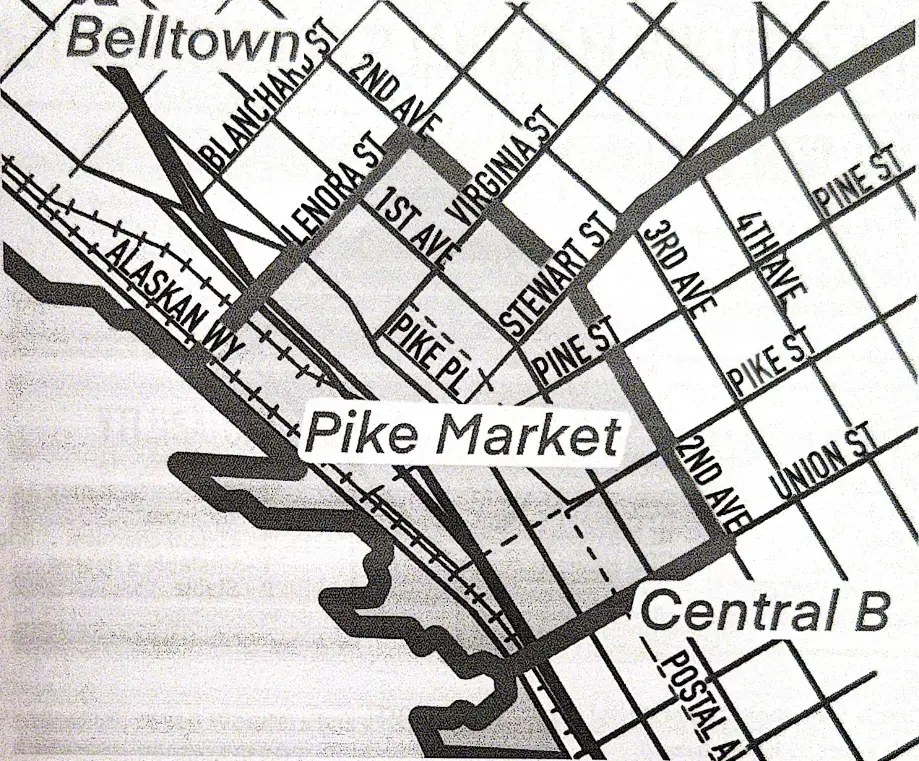
What is the minimum number of blocks between Blanchard St and Stewart St along parallel streets?
Two blocks
Three blocks
Five blocks
Seven blocks
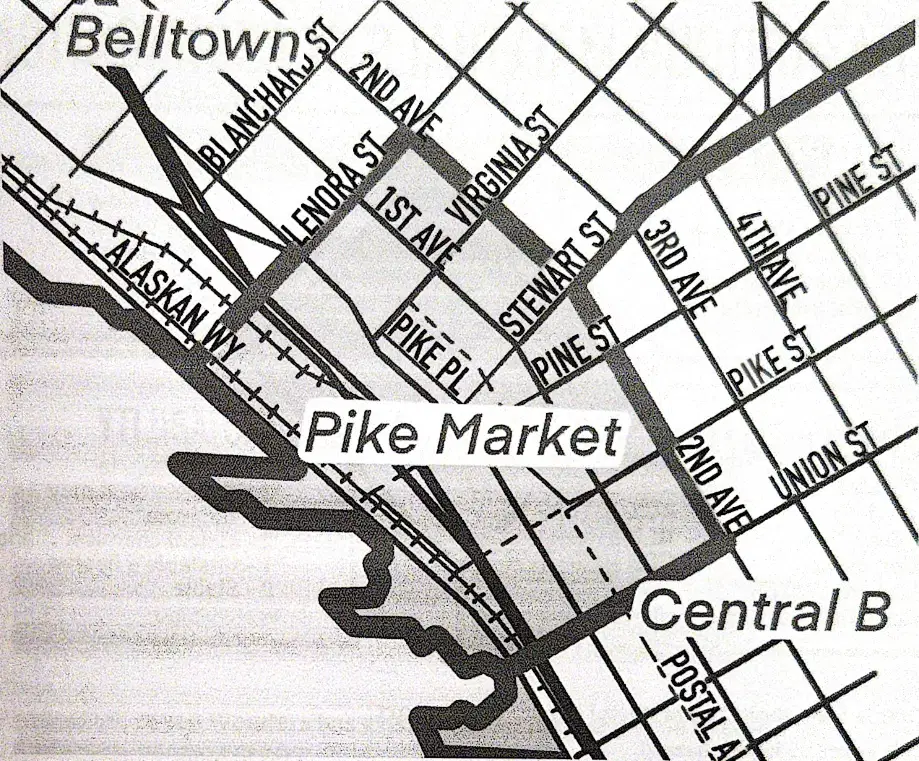
Standing at 2nd Ave and Pine St, which turn leads most directly toward Alaskan Way?
Turn east onto Pine St
Turn west onto Pine St
Turn south onto 2nd Ave
Turn north onto 2nd Ave

Which pair of streets intersects within the Pike Market area as shown?
Virginia St and Alaskan Way
Stewart St and 2nd Ave
Union St and 4th Ave
Pike Pl and 1st Ave
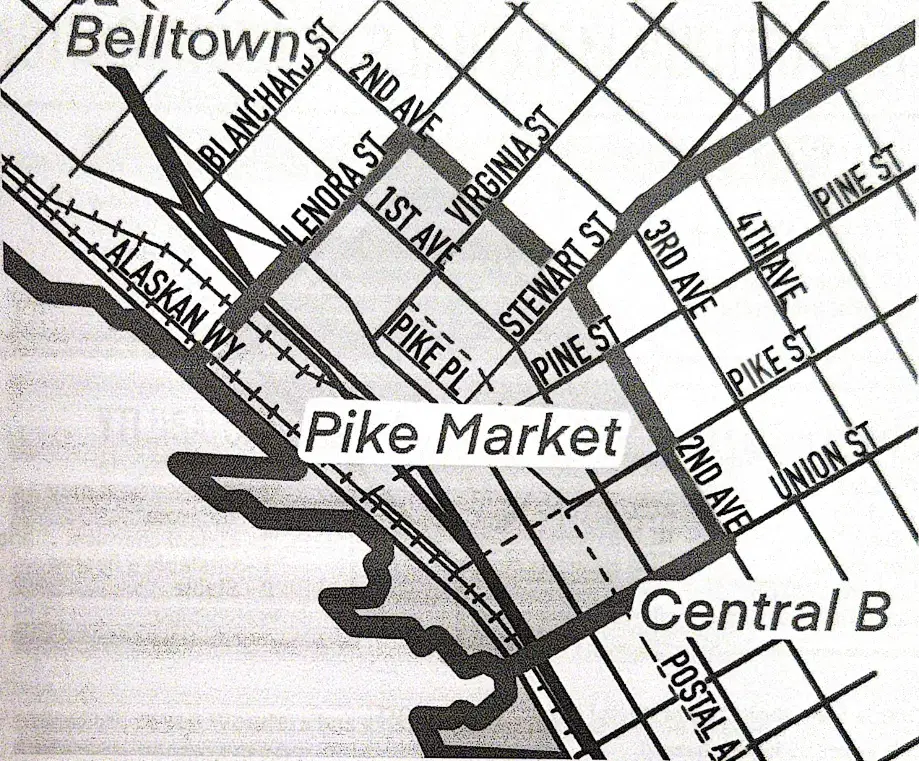
From 3rd Ave and Union St, which route reaches Stewart St in the fewest straight blocks?
North on 3rd Ave
South on 3rd Ave
West on Union St
East on Union St
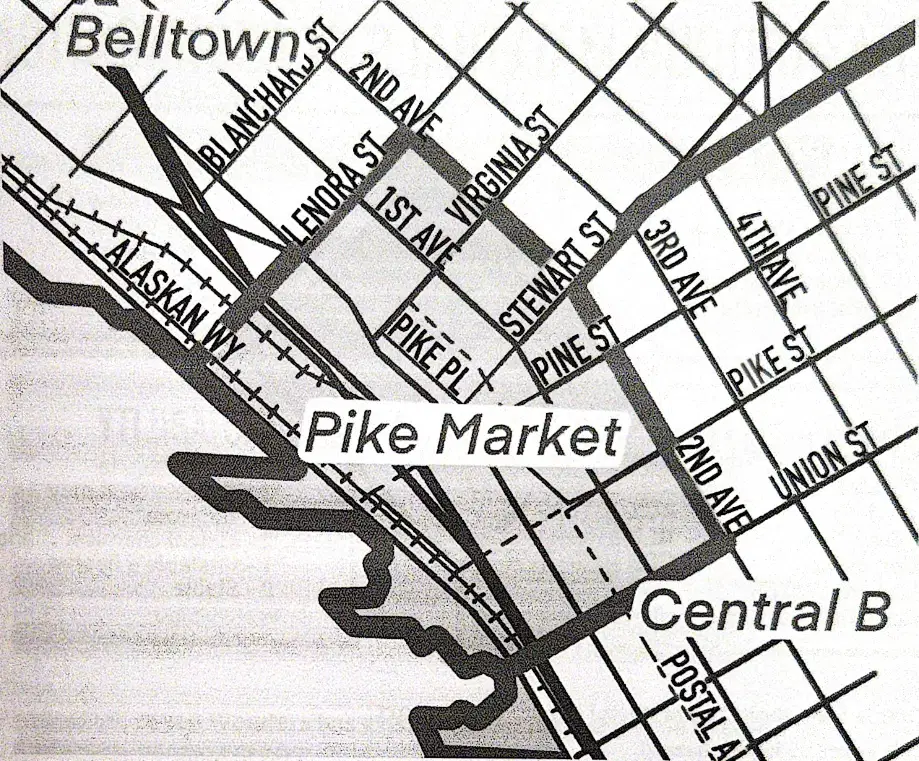
Which street runs diagonally compared to the rectangular grid of avenues and streets?
Union St
Stewart St
Pine St
Alaskan Way

What is the best description of the general orientation of numbered avenues (1st Ave, 2nd Ave, 3rd Ave)?
They are short dead-end lanes
They curve around Pike Market
They run east–west
They run north–south
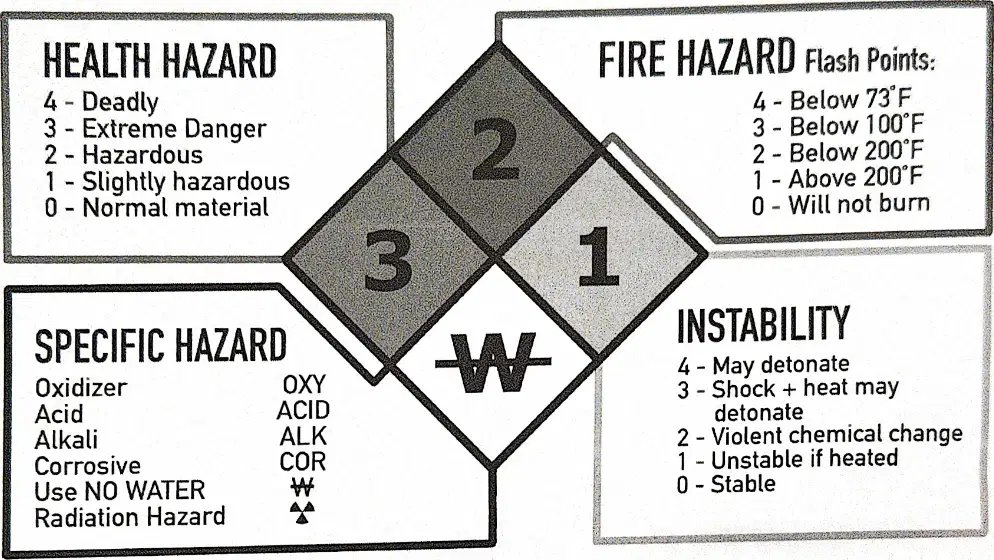
In the NFPA diamond, what does the blue section represent for hazardous materials?
Instability hazard rating
Health hazard rating
Specific special hazards
Fire hazard rating
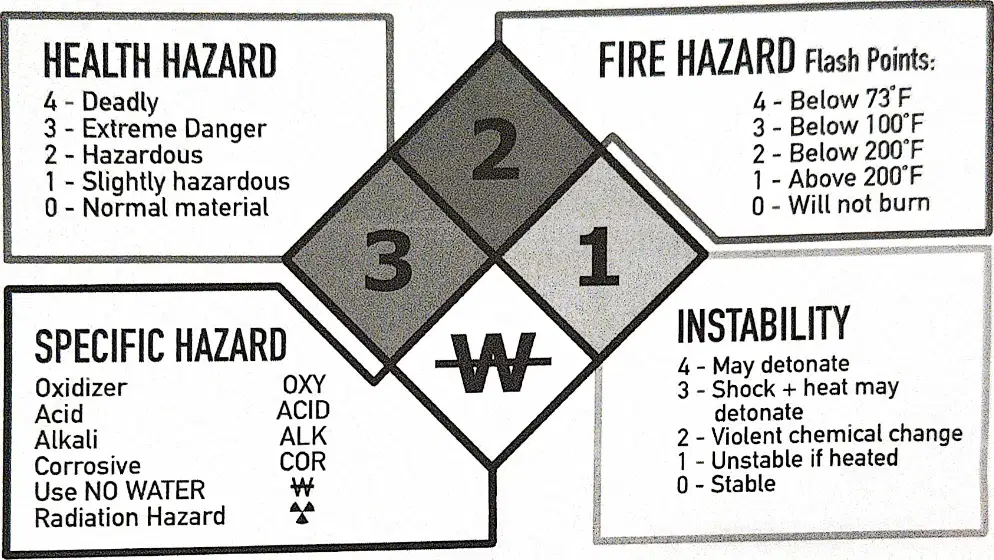
A red rating of 1 indicates what about a material’s flash point?
Below 100°F flash point
Above 200°F flash point
Below 73°F flash point
Will not burn under heat
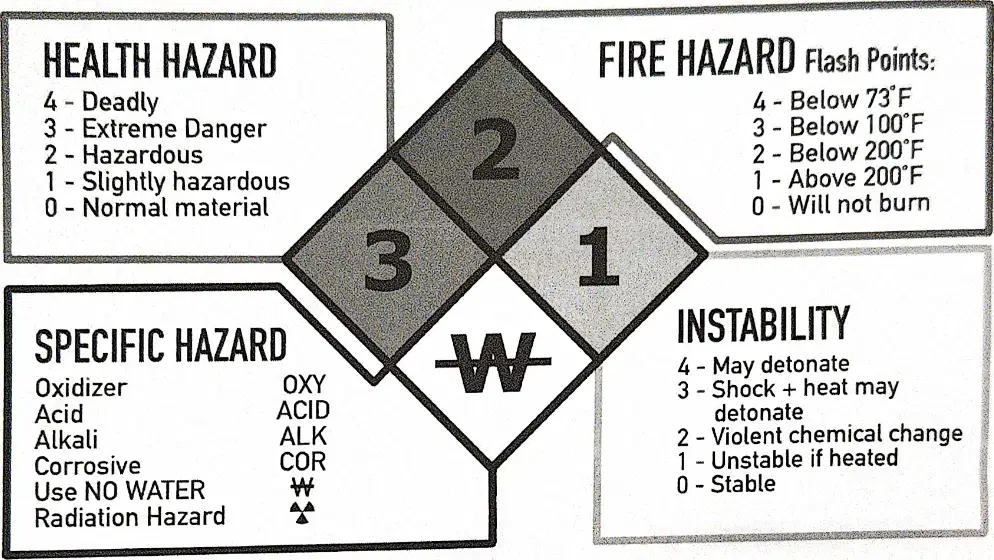
What does a yellow instability rating of 4 indicate?
May detonate with little initiation
Unstable if heated
Violent chemical change
Stable under normal conditions
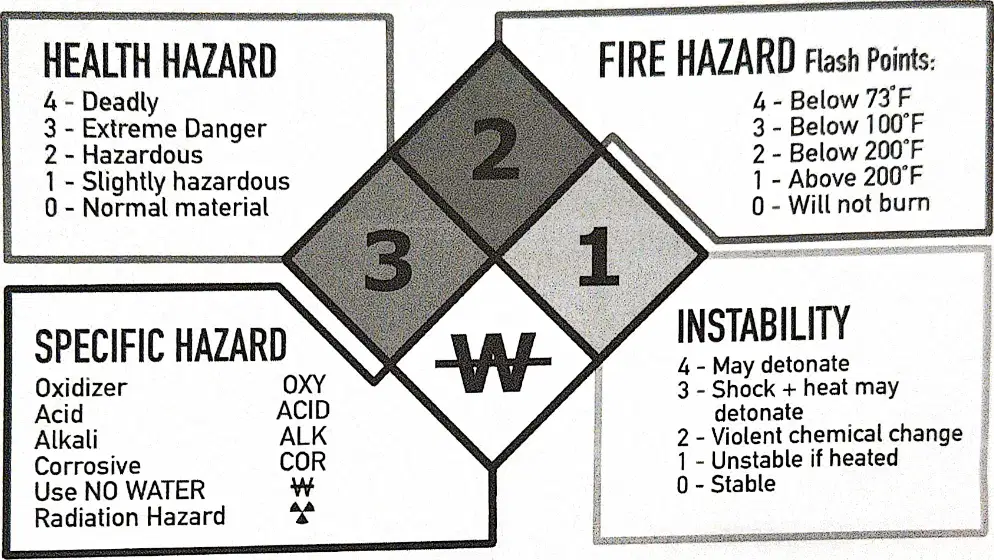
Which special hazard symbol indicates a material should not be combined with water?
OXI label for oxidizer
COR label for corrosive
ALK label for alkali
W with bar for water reactive
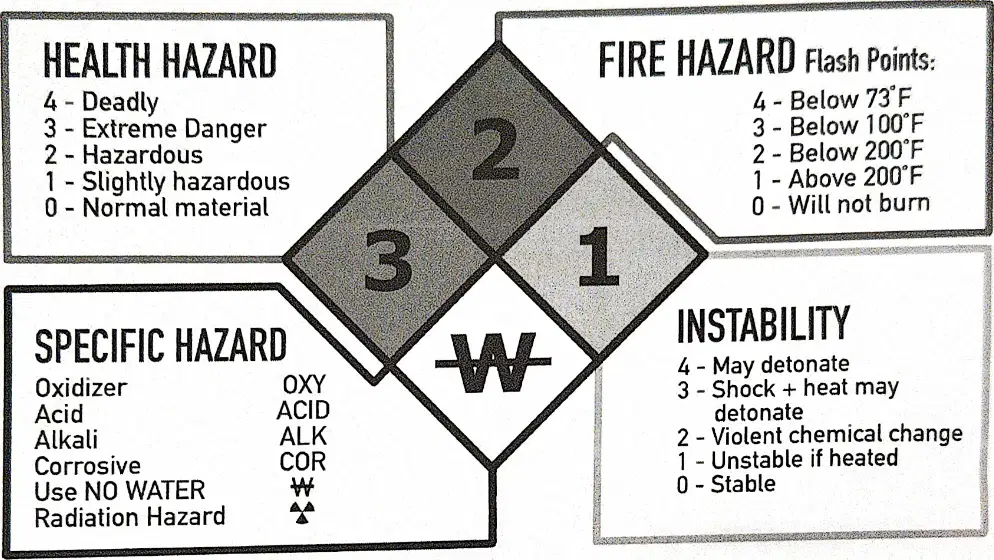
According to the chart, what is the meaning of a blue health rating of 3?
Deadly with minimal exposure
Extreme danger to health
Slightly hazardous exposure
Normal material risk
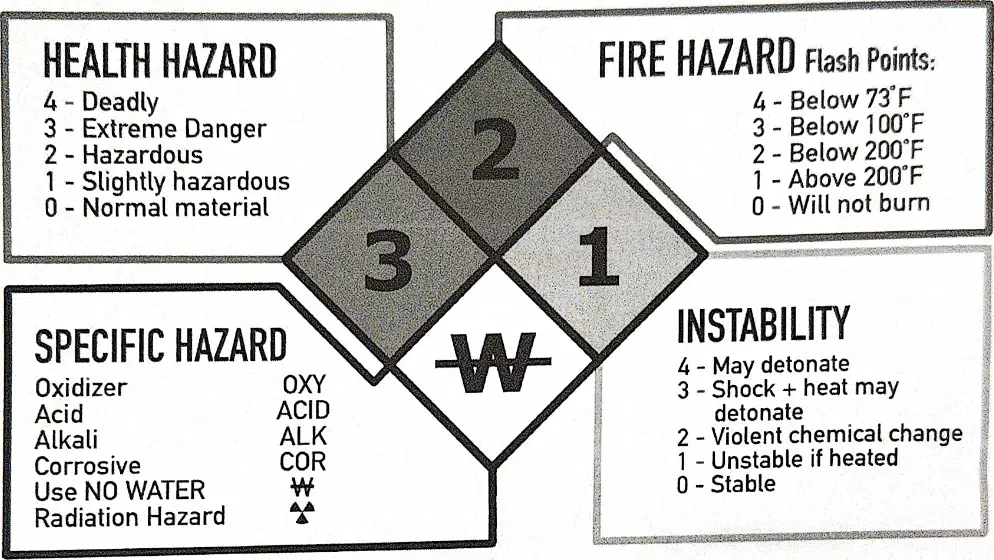
If a substance has red 0, what is the best safety assumption about burning?
Ignites below 73°F
Burns only above 200°F
Burns below 100°F
Will not burn at any temperature
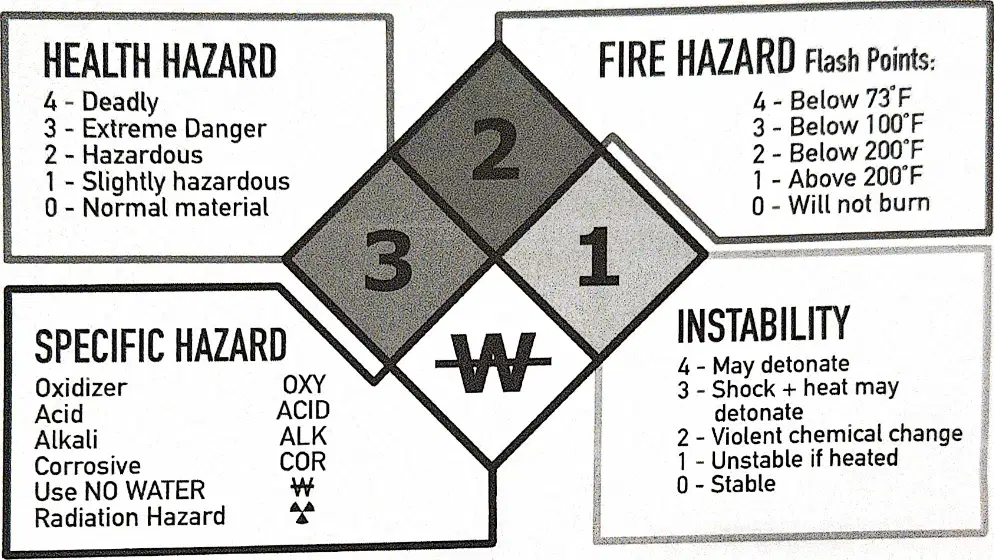
A material labeled COR in the white section most likely has what property?
Causes rapid oxidation
Causes chemical corrosion
Contains strong alkali
Emits radioactive energy
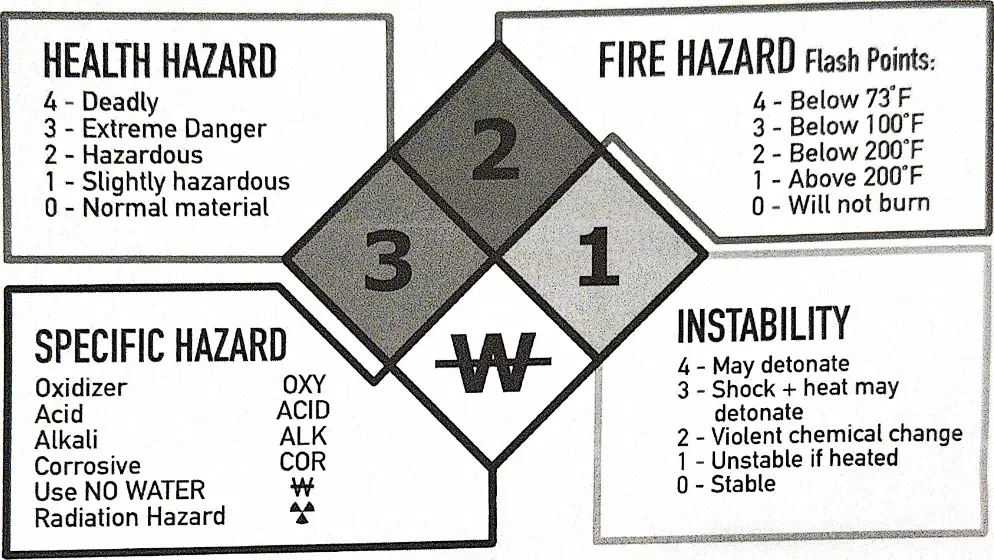
Which combination best describes a substance that is extremely flammable and slightly hazardous to health?
Red 1, blue 3
Red 0, blue 2
Red 4, blue 1
Red 3, blue 4
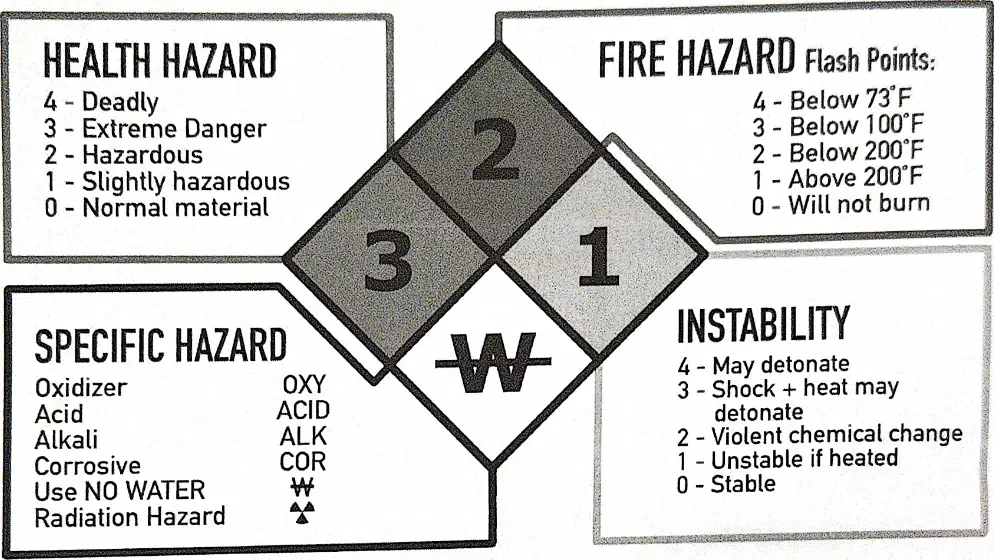
If a container shows yellow 2, what should responders infer about stability?
Detonation may occur
Violent chemical change likely
Unstable when heated
Stable during normal handling

Given the NFPA diamond showing blue 3, red 1, yellow 2, and W in white, which safety step is most important?
Store only below 73°F
Avoid inhalation and skin contact
Use water to dilute spills
Shake container to test stability
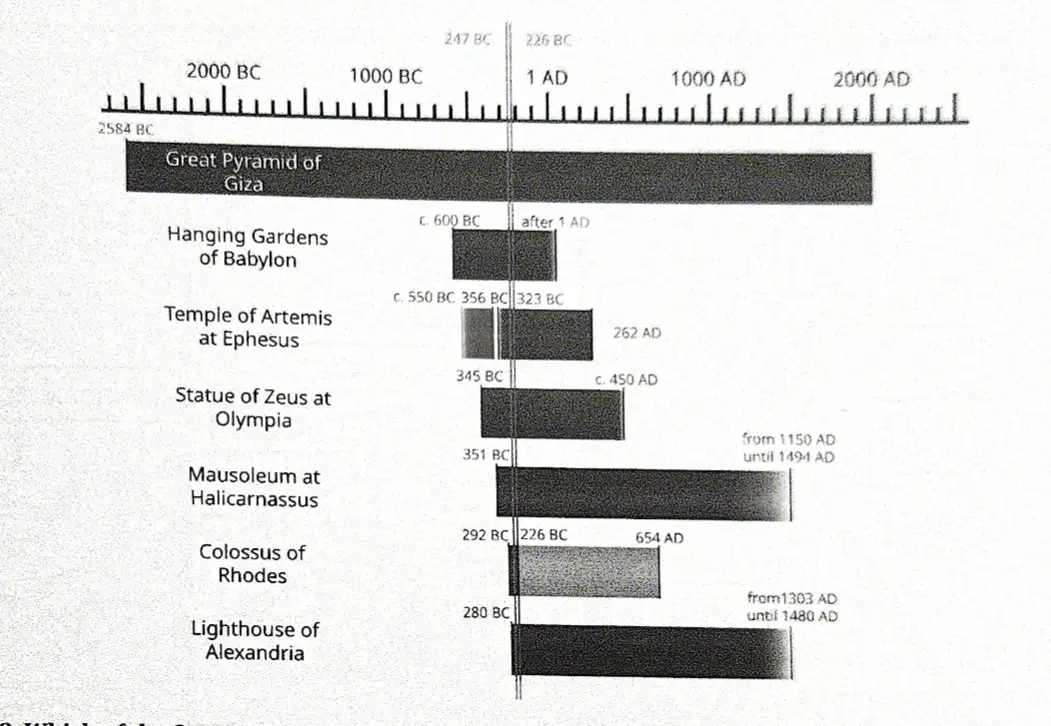
According to the timeline, which Wonder shows the longest span of existence?
Great Pyramid of Giza
Mausoleum at Halicarnassus
Temple of Artemis at Ephesus
Lighthouse of Alexandria
Which structure was created earliest among the listed Wonders?
Temple of Artemis at Ephesus
Mausoleum at Halicarnassus
Lighthouse of Alexandria
Hanging Gardens of Babylon

Which Wonder’s bar begins around 292 BC and ends at 654 AD?
Colossus of Rhodes
Temple of Artemis at Ephesus
Statue of Zeus at Olympia
Lighthouse of Alexandria

What approximate start date is marked for the Temple of Artemis at Ephesus?
c. 550 BC
c. 351 BC
c. 600 BC
c. 345 BC

Which Wonder is shown with activity “from 1303 AD until 1480 AD”?
Lighthouse of Alexandria
Statue of Zeus at Olympia
Mausoleum at Halicarnassus
Hanging Gardens of Babylon

Which Wonder’s label includes dates 345 BC to c. 450 AD?
Colossus of Rhodes
Temple of Artemis at Ephesus
Mausoleum at Halicarnassus
Statue of Zeus at Olympia
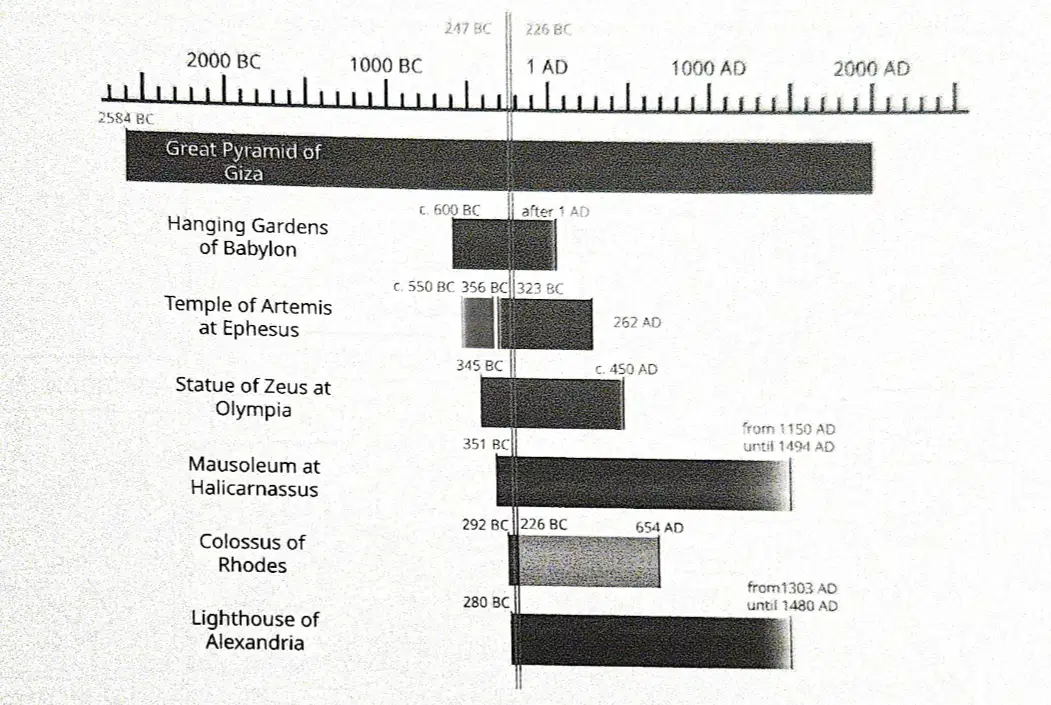
Which Wonder begins around 351 BC and notes activity from 1150 AD until 1454 AD?
Great Pyramid of Giza
Mausoleum at Halicarnassus
Hanging Gardens of Babylon
Colossus of Rhodes
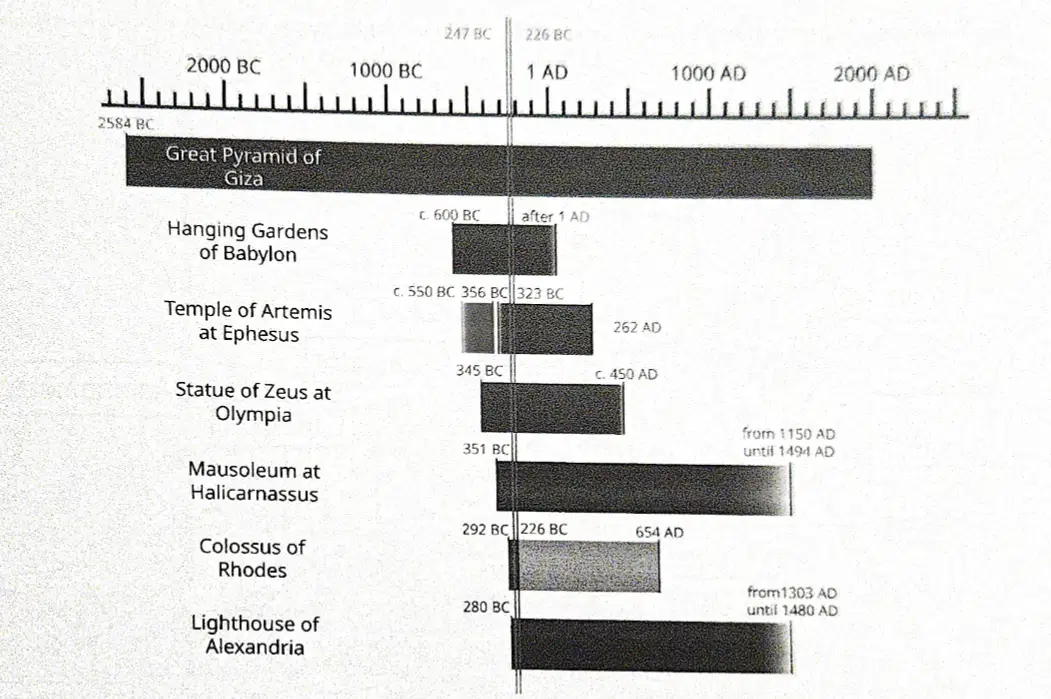
Which Wonder’s start is marked around 280 BC?
Temple of Artemis at Ephesus
Hanging Gardens of Babylon
Lighthouse of Alexandria
Statue of Zeus at Olympia

Which Wonder is indicated with the note “after 1 AD” continuing from 2584 BC?
Hanging Gardens of Babylon
Great Pyramid of Giza
Temple of Artemis at Ephesus
Mausoleum at Halicarnassus
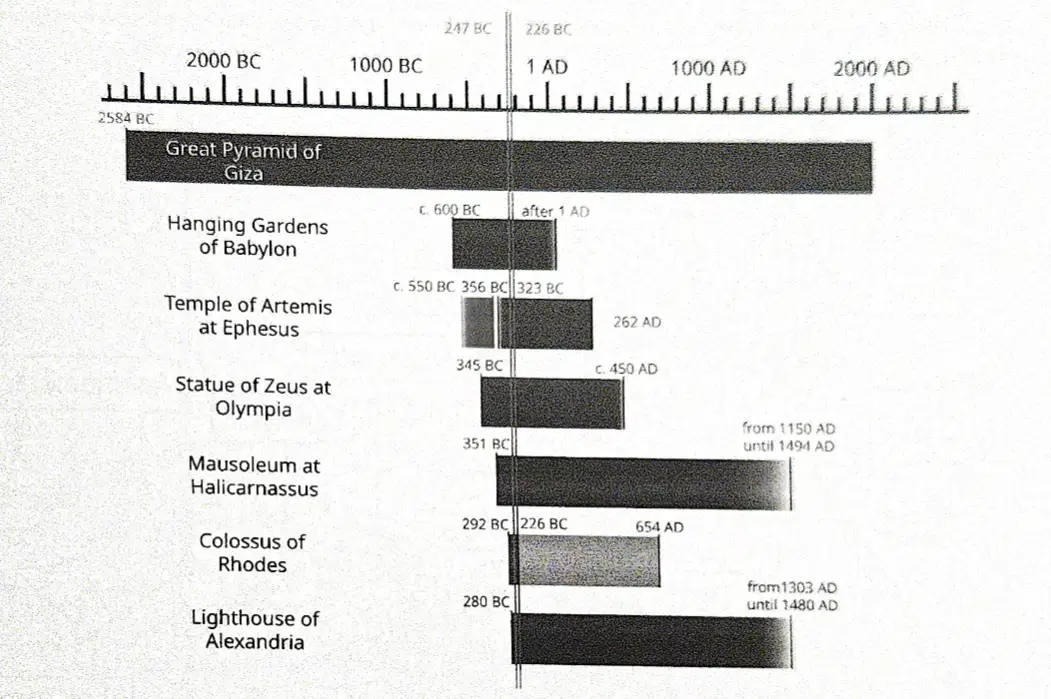
Which Wonder lists clustered dates c. 356 BC and 323 BC within its span?
Colossus of Rhodes
Statue of Zeus at Olympia
Mausoleum at Halicarnassus
Temple of Artemis at Ephesus

In the wind turbine schematic, which component measures wind speed to inform control decisions?
Controller device near generator housing
Yaw motor assembly at the tower top
Anemometer sensor mounted on the nacelle
Wind vane fin behind the rotor hub

Which labeled part adjusts blade angle to regulate power output?
Pitch mechanism at the blade root
Low-speed shaft from the rotor
Brake unit on the main shaft
Gear box connected to generator
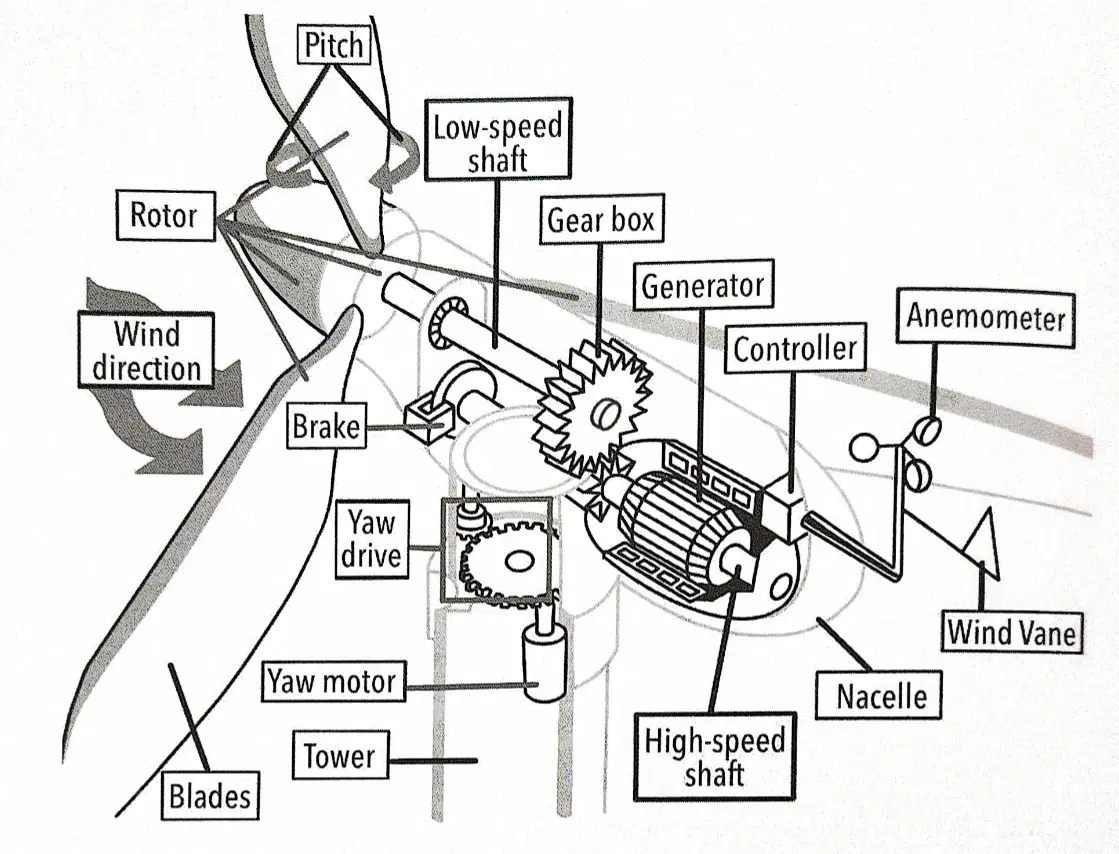
What connects the rotors to the gear box in the schematic?
The low-speed shaft from the rotor
The generator assembly housing gears
The yaw drive atop the tower
The high-speed shaft to the generator
Which component converts rotational mechanical energy into electrical energy?
Brake mounted near rotor hub
Generator next to high-speed shaft
Controller unit beside nacelle
Yaw motor at tower junction

In the diagram, which part helps the turbine face the wind direction?
Brake stopping the rotor
Pitch adjusting blade angle
Yaw drive rotating the nacelle
Gear box coupling the shafts

Which pair of instruments together provide wind information for orientation and control?
Rotor and blades
Anemometer and wind vane
Brake and pitch system
Controller and gear box

What is the role of the gear box according to the schematic’s flow of motion?
Stop rotation during maintenance
Increase rotor speed to the generator
Convert electricity to mechanical torque
Measure wind speed and direction

Which shaft connects directly to the generator in the image?
Low-speed shaft from rotor
High-speed shaft leaving gear box
Yaw motor drive shaft
Pitch control linkage

Where are the blades located relative to the nacelle in the schematic?
Behind the nacelle near instruments
In front of the nacelle at rotor hub
Below the tower beside yaw motor
Inside the nacelle near gear box

Which component would engage to stop the rotor from spinning during high winds?
Wind vane changing direction
Pitch increasing blade angle
Brake on the main shaft
Controller issuing commands

Which axis on the diagram represents galaxy color from blue to red?
No axis labeled color
Vertical axis labeled color
Horizontal axis labeled luminosity
Diagonal axis through cloud shapes

What does the horizontal axis of the diagram measure?
Galaxy distance from Earth
Temperature from cold to hot
Star formation rate
Luminosity from low to high

According to the diagram, which category spans the widest range of luminosity?
Red sequence galaxies
Green valley galaxies
Blue cloud galaxies
All categories equally

Which category appears lowest on the color axis, indicating bluer color?
Blue cloud
None labeled
Red sequence
Green valley

If a galaxy is in the green valley, how does its color compare to the other two categories?
Redder than red sequence
Bluer than blue cloud
Between red sequence and blue cloud
Exactly the same as blue cloud

A student claims luminosity increases upward on the diagram. What correction should be made?
Luminosity is constant across
Luminosity increases right to left
Luminosity increases left to right
Luminosity increases downward

Which description best matches red sequence galaxies in this diagram?
Generally red and wide luminosity range
Generally blue and narrow luminosity range
Generally green and lowest luminosity
Color varies widely without trend

A galaxy plotted at low luminosity and very blue color would most likely fall into which category?
Red sequence
None of the categories
Green valley
Blue cloud

Which statement about category positions is supported by the diagram?
Blue cloud sits below green valley
Red sequence sits below blue cloud
All three categories overlap perfectly
Green valley sits above red sequence

If a galaxy transitions from blue cloud to red sequence, what change in color does the diagram suggest?
Color becomes bluer overall
Color becomes redder overall
Color stays exactly the same
Color cycles from red to blue repeatedly

Which galaxy type in the diagram is shown with the largest range of color?
Red sequence shows widest color spread
Green valley shows widest color spread
All types display equal color range
Blue cloud shows widest color spread

On the Handling Qualities Rating Scale, what pilot rating corresponds to Excellent characteristics with no pilot compensation needed?
Level 1 indicates excellent, no compensation
Level 3 indicates excellent, no compensation
Level 5 indicates excellent, no compensation
Level 7 indicates excellent, no compensation

Which description matches the Good category on the scale?
Minor but annoying deficiencies, moderate compensation
Negligible deficiencies, pilot compensation not a factor
Very objectionable but tolerable deficiencies, extensive compensation
Major deficiencies, compensation required for control

Fair handling qualities require what level of pilot compensation?
Extensive compensation for adequate performance
Moderate compensation for desired performance
Minimal compensation to achieve desired performance
Considerable compensation to retain control
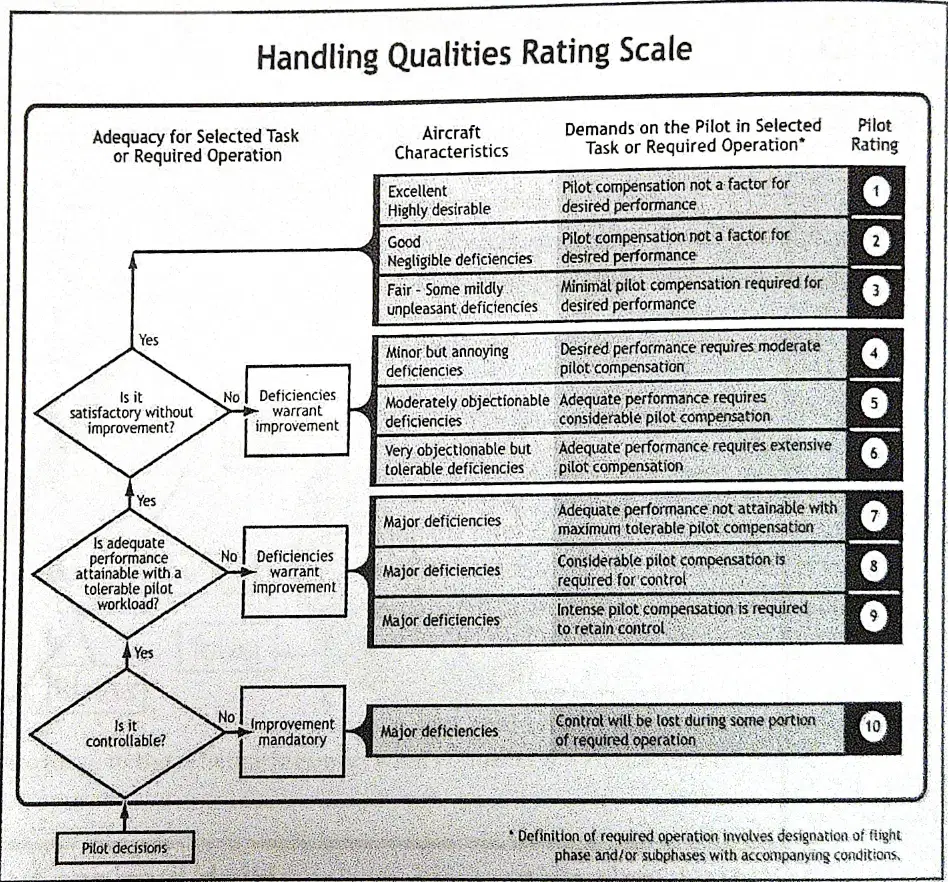
When deficiencies are minor but annoying, which pilot rating applies?
Rating 4 applies to minor but annoying
Rating 2 applies to minor but annoying
Rating 6 applies to minor but annoying
Rating 8 applies to minor but annoying
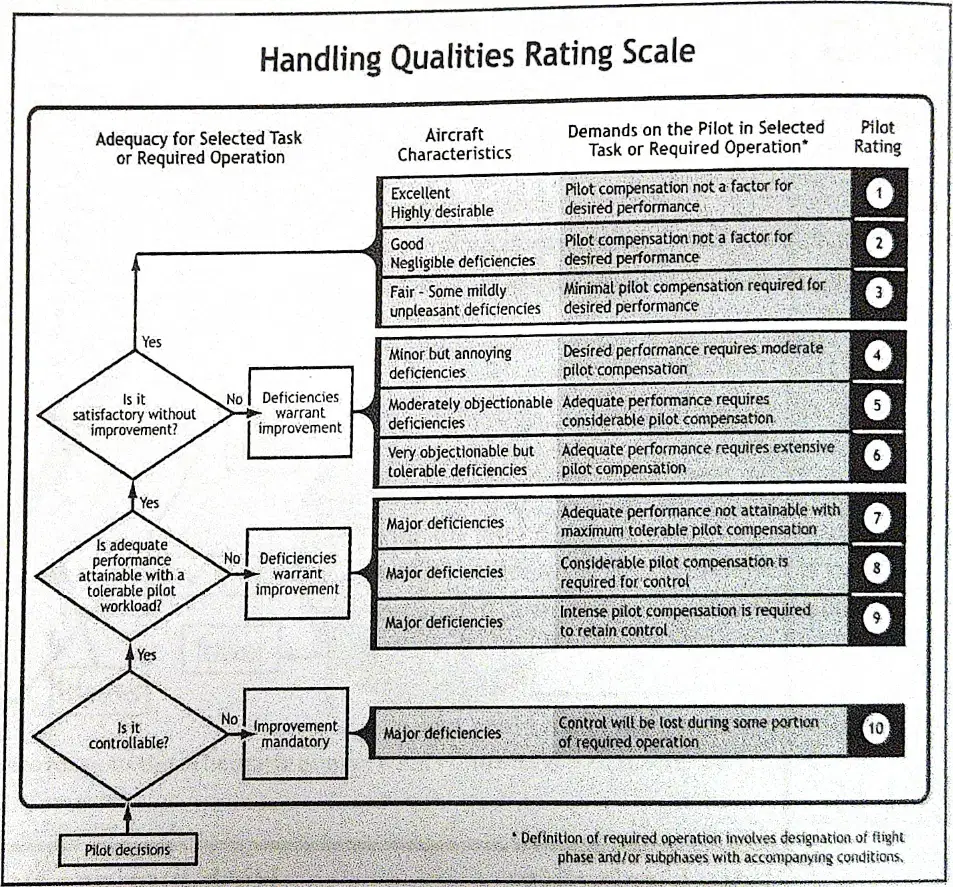
Adequate performance requiring considerable pilot compensation corresponds to which category?
Moderately objectionable deficiencies with adequate performance
Excellent characteristics highly desirable
Major deficiencies with loss of control
Good characteristics with negligible deficiencies

Which statement is true about very objectionable but tolerable deficiencies?
Control will be lost during operation
Pilot compensation not a factor at all
Desired performance needs minimal compensation
Adequate performance requires extensive compensation

What does the scale indicate when adequate performance is not attainable even with maximum tolerable pilot compensation?
Very objectionable deficiencies with rating 6
Negligible deficiencies with rating 2
Minor deficiencies with rating 4
Major deficiencies with rating 7

If considerable pilot compensation is required for control, which rating applies?
Rating 3 indicates fair performance
Rating 8 indicates major deficiencies
Rating 5 indicates moderate compensation
Rating 1 indicates excellent control

Which condition corresponds to rating 10 on the scale?
Adequate performance with extensive compensation
Control lost during some portion of the operation
Pilot compensation not a factor for performance
Minimal compensation needed to meet performance
What does the acronym LEL stand for in gas safety contexts?
Limiting exposure level
Least energy level
Lower explosive limit
Lower emission level
If flammable gas concentration is below 5% LEL and oxygen is under 23%, which action is allowed?
Inspection permitted
Entry not permitted
Cold work permitted
Hot work permitted

When flammable gas concentration is below 10% LEL but oxygen is not checked, what is the allowed activity?
Entry not permitted
Inspection permitted
Cold work permitted
Hot work permitted

Which threshold allows inspection when flammable gas concentration is below a certain LEL percentage?
Below 5% LEL
Below 10% LEL
Below 50% LEL
Below 25% LEL

According to the chart, what happens if flammable gas concentration is not less than 5% LEL at the first decision point?
Hot work not permitted
Cold work permitted
Inspection permitted
Hot work permitted

Which oxygen concentration condition must be met for hot work to be permitted?
Oxygen ≥ 23%
Oxygen between 19–21%
Oxygen < 23%
Oxygen = 21%

If the gas concentration is not less than 10% LEL after hot work is disallowed, what is the chart’s directive?
Cold work permitted
Cold work not permitted
Entry not permitted
Inspection permitted

At the lowest branch, if concentration is not less than 25% LEL, what is the outcome?
Hot work not permitted
Inspection permitted
Entry not permitted
Cold work permitted

Arrange the permitted activities from most stringent to least stringent as concentration limits increase.
Cold work → Hot work → Inspection
Hot work → Cold work → Inspection
Hot work → Inspection → Cold work
Inspection → Cold work → Hot work

Which statement best describes the decision tree’s purpose?
Set gas sampling frequency
Guide work decisions in gas hazards
Replace oxygen sensors entirely
Calculate exact LEL values for gases
A welder finds methane at greater than 5% of the lower explosive limit, but less than 10%, and oxygen concentration is 8%. What is the most accurate action based on the safety flowchart?
No one may enter the room
The welder may do cold work
The welder may do neither hot nor cold work, but a safety inspector may enter the room
The welder may do hot work
Under which condition would a safety inspection be most appropriate?
5% or greater of the LEL of a combustible gas, but less than 10%
Concentration of combustible gas in an area exceeds 25%
10% or greater of the LEL of a combustible gas, but less than 25%
Less than 5% of the LEL of a combustible gas in an area
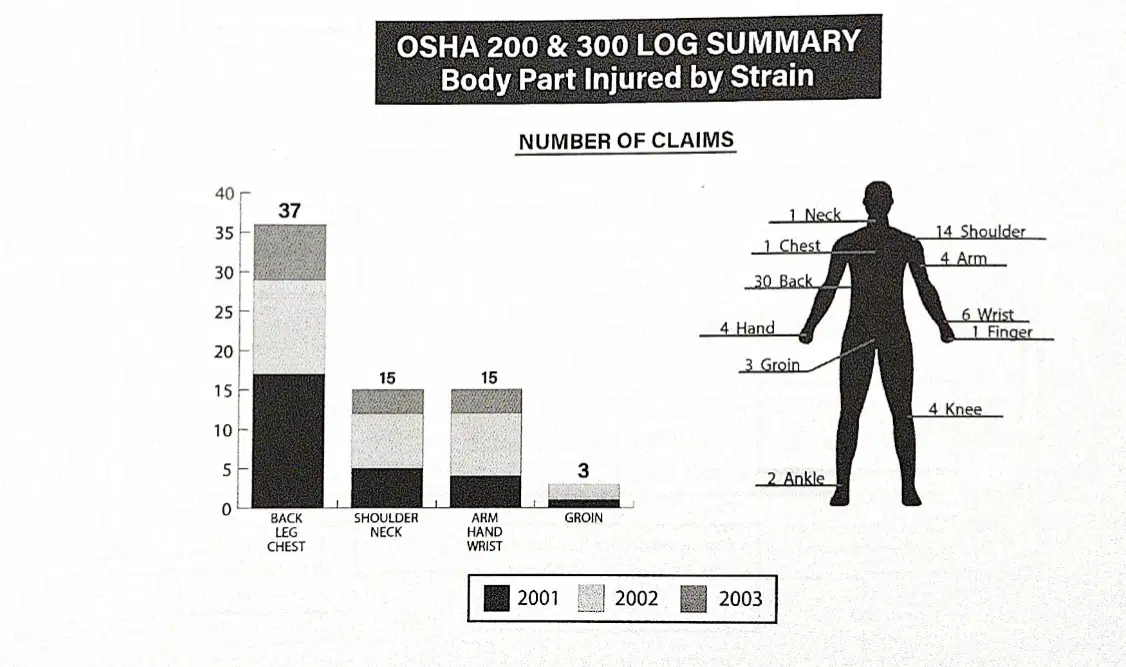
According to the OSHA 200 & 300 log summary bar chart, which year had the lowest total number of injury claims?
2003
2002
2001
All years were equal
Which body part shows the highest number of strain claims on the silhouette figure?
Knee
Shoulder
Back
Neck
If an area has 12% of the LEL of a combustible gas, what action is indicated by the options provided?
Schedule a safety inspection
Evacuate and prohibit entry
Proceed without inspection
Begin hot work immediately

In the chart, which category totals 3 claims across the years 2001–2003?
Shoulder/Neck
Back/Leg/Chest
Arm/Hand/Wrist
Groin
A reading shows oxygen at 8% in a room. Which option best explains why hot work should not proceed?
Low oxygen indicates insufficient breathing air
Low oxygen prevents metal from heating properly
Low oxygen shows gas concentration is zero
Low oxygen can increase combustion risk
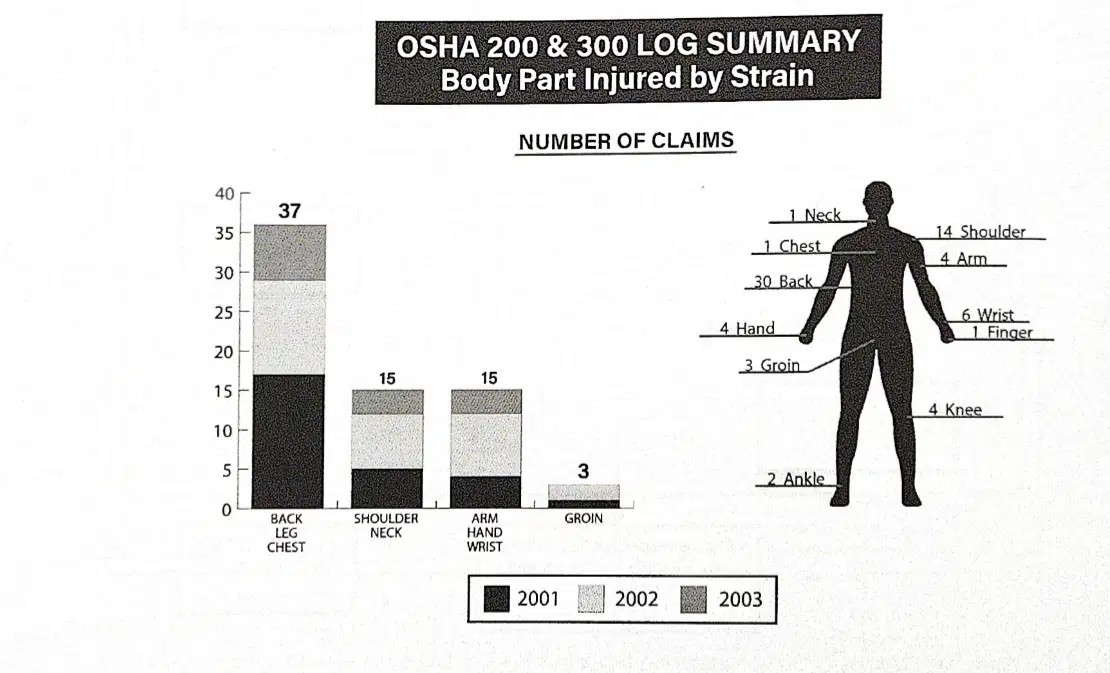
On the silhouette, which limb area has 6 wrist strain claims and 1 finger claim?
Knee and ankle area
Shoulder joint area
Forearm and hand area
Upper arm region
Which statement matches the LEL thresholds presented?
Less than 5% LEL: inspection required
>25% LEL: normal operations
5%–<10% LEL: inspection appropriate
10%–<25% LEL: proceed with hot work

Using the bar chart legend, how are the years indicated within each stacked bar?
By distinct colors for 2001, 2002, 2003
By different bar widths for each year
By separate charts for each year
By labels written atop each segment
Which statement best describes the trend in back/leg/chest injuries between 2001 and 2002?
Count increased while proportion stayed the same
Count decreased but proportion increased from 2001 to 2002
Both count and proportion increased from 2001 to 2002
Both count and proportion decreased from 2001 to 2002
Over the three recorded years, which claim about shoulder injuries is accurate?
They were the lowest category across all years
They were the highest every single year
They were not the highest in any single year
They always exceeded arm/hand/wrist injuries

In 2011, which industry shows Alaska’s injury incidence rate noticeably higher than the U.S. overall?
Service providing industries overall
Information sector generally
Leisure and hospitality sector
Construction sector specifically

Which goods-producing industry displays the highest injury rate in Alaska according to the chart?
Manufacturing sector in Alaska
Construction sector in Alaska
Natural resources/mining in Alaska
Other services within goods

Which service-providing industry has the highest injury rate in the U.S. overall?
Leisure and hospitality
Trade, transportation, and utilities
Professional and business services
Educational and health services

For most listed occupations, how does Alaska’s incidence rate compare to the U.S. overall?
Equal between Alaska and the U.S.
Lower in Alaska for most occupations
Higher in Alaska for most occupations
Alaska higher only for information

Which statement about private industry overall is supported by the chart?
Both rates are identical and low
U.S. overall exceeds Alaska’s rate
Alaska’s rate exceeds the U.S. overall
Rates are identical and relatively high

Which industry shows Alaska’s rate notably lower than the national rate?
Leisure and hospitality
Educational and health services
Information industry
Private industry overall

Within service-providing industries, which sector in Alaska appears to have a moderate injury rate lower than leisure and hospitality?
Financial activities
Trade, transportation, and utilities
Educational and health services
Professional and business services

