
Resource Type


8th Grade Graphing from a Table Quizzes
Test your Grade 8 graphing from a table skills with this comprehensive mathematics quiz designed to assess your understanding of creating accurate graphs from data sets. Practice essential data representation techniques through targeted questions that provide instant feedback to strengthen your graphing abilities.

67 questions
Graphing from a table

Quiz
•
8th Grade

20 questions
Graphing Equations from a Table
Quiz
•
8th Grade

20 questions
Graphing Points from Tables Easy
Quiz
•
8th Grade
20 questions
Graphing from Points and Tables
Quiz
•
8th Grade

20 questions
Graphing Linear Equations
Quiz
•
8th Grade

10 questions
Graphing from a Table
Quiz
•
8th - 9th Grade
10 questions
Graphing From a Table
Quiz
•
8th - 9th Grade
16 questions
Graphing from a Table of Values
Quiz
•
8th - 10th Grade
25 questions
Graphing from a table
Quiz
•
6th - 8th Grade
21 questions
Graphing from a Table of Values
Quiz
•
7th - 9th Grade
14 questions
Graphing From a Table
Quiz
•
8th - 11th Grade
14 questions
Graphing from a Table
Quiz
•
8th - 11th Grade
Explore 8th Grade Graphing from a Table Quizzes
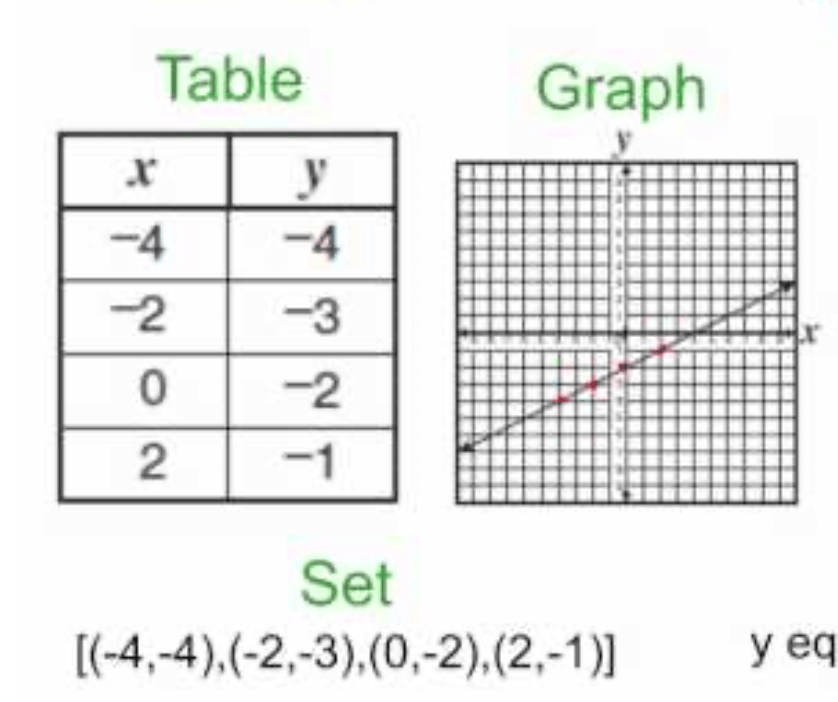
Graphing from a Table represents a fundamental skill in Grade 8 mathematics that bridges raw data interpretation with visual representation. Through Wayground's comprehensive quiz collection, students engage with targeted practice questions that develop their ability to accurately plot coordinate points, identify patterns in tabular data, and construct various types of graphs including line graphs, scatter plots, and bar charts. These assessment tools provide immediate feedback as students work through problems involving linear relationships, trend analysis, and coordinate plane navigation, helping them build confidence in translating numerical information into meaningful visual displays that communicate mathematical relationships clearly. Wayground's platform empowers teachers with access to millions of educator-created quizzes specifically designed for graphing from tables instruction, featuring robust search and filtering capabilities that align with curriculum standards and learning objectives. The digital-first delivery format allows for seamless differentiation through customizable question sets, adaptive difficulty levels, and real-time progress monitoring that supports both individual and whole-class instruction. Teachers can efficiently identify students requiring additional support in coordinate plotting or table interpretation, while simultaneously providing enrichment opportunities for advanced learners through more complex graphing scenarios, making this resource invaluable for targeted skill reinforcement, formative assessment, and comprehensive remediation planning.
FAQs
How do I teach eighth graders to graph a relationship from a table?
Start by having students label the independent and dependent variables, convert each row into an ordered pair, and select an axis scale that fits the data. Once the points are plotted, connect the table to the graph by discussing rate of change, initial value, and whether the relationship is linear.
What exercises help Grade 8 students practice graphing from tables?
Mix straightforward plotting with tasks that ask students to choose scales, compare two tables, and decide whether the plotted points form a linear relationship. For example, students can graph a table in which y increases by 3 whenever x increases by 1, then explain where that constant change appears on the graph.
What are common errors when students graph functions from tables?
Watch for three recurring errors: swapping x and y, treating unequal axis intervals as equal, and connecting points that do not represent a continuous situation. Students may also identify a relationship as linear simply because the points rise, without checking for a constant rate of change.
How can teachers assign a Grade 8 graphing-from-a-table quiz on Wayground?
Wayground quizzes are available as printable PDFs and digital formats, so teachers can host one as a digital quiz or assign it on paper. Each quiz has a complete answer key; paper submissions can also be scanned or captured for grading in the Wayground for Teachers app.
How does graphing from a table align with Grade 8 Common Core math?
Common Core uses tables and graphs to help students understand functions and linear relationships. Grade 8 students build on proportional graphs by identifying rate of change and initial value, then connect those features to an equation such as y = mx + b.
How can I support diverse learners with a graphing-from-a-table quiz?
For students who lose their place between rows and coordinates, create a quiz version with larger text or wider spacing. In digital sessions, extended time can support careful plotting, while reduced answer choices can help students focus on interpreting the relationship rather than managing too many options.
What graphing-from-a-table skills should Grade 8 students know?
Grade 8 students should be able to plot ordered pairs accurately, choose a workable scale, recognize whether a table shows a linear function, and relate the graph's slope and intercept to the numerical pattern in the table.

Accessibility
Features
Wayground Super
School & District
Wayground for Business
Create a quiz
Create a presentation
Wayground AI
Subjects
Mathematics
Social Studies
Science
Physics
Chemistry
Biology
About
Our Story
Wayground Blog
Media Kit
Careers
Support
F.A.Q.
Help & Support
Privacy Policy
Terms of Service
Teacher Resources
2026 Wayground


Get our app

