
Resource Type


8th Grade Graphing with Tables Quizzes
Master Grade 8 graphing with tables through this comprehensive quiz designed to assess your understanding of creating and interpreting graphs from data tables. Practice essential data representation skills with instant feedback to strengthen your ability to transform tabular information into meaningful visual displays.

5 questions
Graphing with Tables

Quiz
•
8th Grade
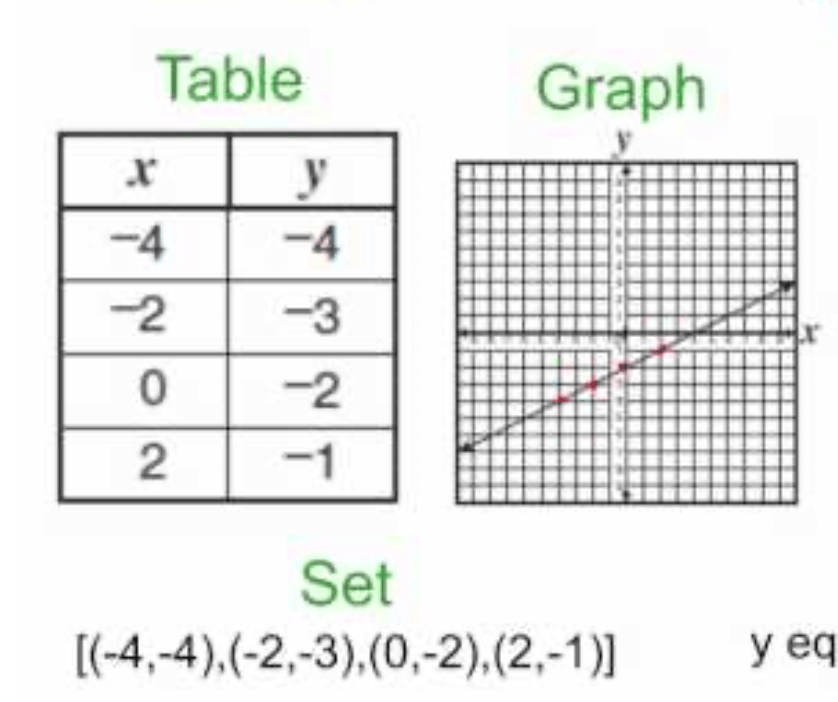
20 questions
Graphing from Points and Tables
Quiz
•
8th Grade

20 questions
Two Way Tables
Quiz
•
8th Grade
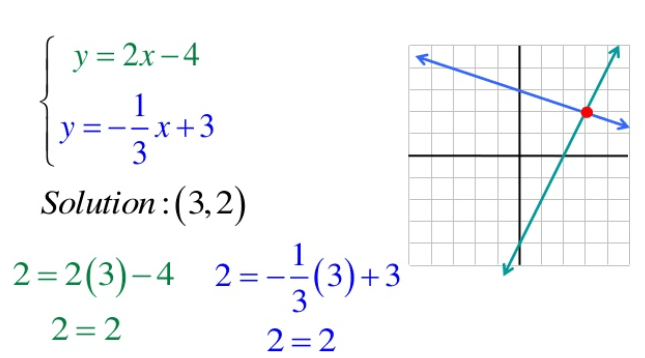
20 questions
Function Graphing Tables Equations
Quiz
•
8th Grade

52 questions
Review: Prop Relationships/Slope/y=mx+b/Graphing/Tables
Quiz
•
8th Grade

20 questions
Test About Graphing Linear Equation
Quiz
•
8th Grade
20 questions
Solving With Graphing
Quiz
•
8th Grade
20 questions
Linear Table Systems of Equations
Quiz
•
8th Grade
16 questions
Graphing Linear Equations using Table of Values
Quiz
•
8th Grade
13 questions
Solving Linear Equations with tables
Quiz
•
6th - 8th Grade
20 questions
Ratios, Ratio Tables and Graphing
Quiz
•
6th Grade
20 questions
Ratios Graphing, Ratio Tables and Equivalent
Quiz
•
6th Grade
Explore 8th Grade Graphing with Tables Quizzes
Graphing with tables forms a fundamental component of Grade 8 mathematics, bridging the critical connection between numerical data organization and visual representation. These comprehensive quiz collections through Wayground provide structured assessment opportunities that help students master the essential skills of creating, interpreting, and analyzing graphs derived from tabular data. Students engage with practice questions that develop their understanding of coordinate plotting, scale selection, and pattern recognition while receiving immediate feedback on their progress. The quizzes systematically build competency in translating between different data representations, ensuring students can confidently move from raw numerical information in tables to meaningful graphical displays that communicate mathematical relationships clearly. Wayground's extensive library contains millions of teacher-created quiz resources specifically designed to support Grade 8 data and graphing instruction with robust search and filtering capabilities that help educators locate materials perfectly aligned to curriculum standards. Teachers can easily customize quiz content to meet diverse learning needs, implementing differentiation strategies that support both struggling learners and advanced students through targeted question selection and difficulty adjustment. The platform's flexible digital delivery system enables seamless integration into various instructional formats, from individual practice sessions to whole-class review activities, while comprehensive analytics help educators identify areas requiring remediation or enrichment. These powerful tools streamline lesson planning and provide ongoing skill reinforcement opportunities that strengthen student mastery of graphing with tables concepts throughout the academic year.
FAQs
How do I teach eighth graders to graph data from a table?
Connect each table row to an ordered pair, then have students place the independent variable on the x-axis and the dependent variable on the y-axis. After plotting, shift the discussion from drawing the graph to explaining its structure: Is the relationship linear, and what do its slope and intercept mean?
What exercises help Grade 8 students practice graphing with tables?
Strong practice asks students to plot tabular values, choose useful axis intervals, and interpret the resulting relationship. For example, give students a time-and-distance table, have them graph it, and ask how the graph shows the rate of change.
What mistakes do Grade 8 students commonly make when graphing tables?
Watch for swapped coordinates, inconsistent scales, unlabeled axes, and points plotted from the wrong table row. With linear data, students may also draw a line that misses plotted points or assume every relationship must pass through the origin.
How can teachers use these Grade 8 quizzes on Wayground?
Assign them as digital quizzes on Wayground or use the printable PDFs for paper-based practice, depending on the teaching environment and student preference. Every quiz has a complete answer key. Printed submissions can also be captured and graded through the Wayground for Teachers app.
Is graphing with tables part of the Grade 8 Common Core math curriculum?
Yes. Common Core emphasizes representing linear relationships through tables, graphs, and equations. Grade 8 students move from plotting tabular values to identifying slope and initial value, comparing two linear relationships, and connecting a graph’s features to the situation it represents.
How can I support students who have difficulty reading tables and graphs?
Break the task into two passes: first highlight corresponding x- and y-values in each table row, then plot them. On Wayground, Read Aloud can support language-heavy prompts, while larger fonts or wider spacing can make tables, coordinates, and graph labels easier to track.
What grade level is graphing with tables taught at?
Graphing from tables appears before middle school, but Grade 8 is where students commonly use it to analyze linear relationships, rates of change, and initial values. The work becomes a bridge from basic coordinate plotting to algebra.

Accessibility
Features
Wayground Super
School & District
Wayground for Business
Create a quiz
Create a presentation
Wayground AI
Subjects
Mathematics
Social Studies
Science
Physics
Chemistry
Biology
About
Our Story
Wayground Blog
Media Kit
Careers
Support
F.A.Q.
Help & Support
Privacy Policy
Terms of Service
Teacher Resources
2026 Wayground


Get our app

