
Filters
Resource Type


10th Grade Line of Best Fit Quizzes
Master Grade 10 Line of Best Fit concepts with this interactive quiz designed to assess your understanding of scatter plots, correlation, and trend analysis. Practice identifying and interpreting lines of best fit through self-paced questions with instant feedback to strengthen your statistical reasoning skills.
50 questions
Line of Best Fit CW

Quiz
•
10th Grade

18 questions
Statistics - Line of Best Fit
Quiz
•
10th Grade

14 questions
Line of Best Fit Linear
Quiz
•
9th Grade

20 questions
Line of Best Fit Practice
Quiz
•
9th Grade

20 questions
Predicting Line of Best Fit
Quiz
•
8th Grade

20 questions
Line of Best Fit Predictions
Quiz
•
8th Grade
15 questions
Slope Line of Best Fit
Quiz
•
8th Grade
20 questions
Prediction Line of Best Fit
Quiz
•
8th Grade
20 questions
Slope Line of Best Fit
Quiz
•
8th Grade
20 questions
Predictions Line of Best Fit
Quiz
•
9th Grade
20 questions
Line of Best Fit Slope Interpretation
Quiz
•
8th Grade
20 questions
Scatter Plot - Line of Best Fit
Quiz
•
8th Grade
Explore 10th Grade Line of Best Fit Quizzes
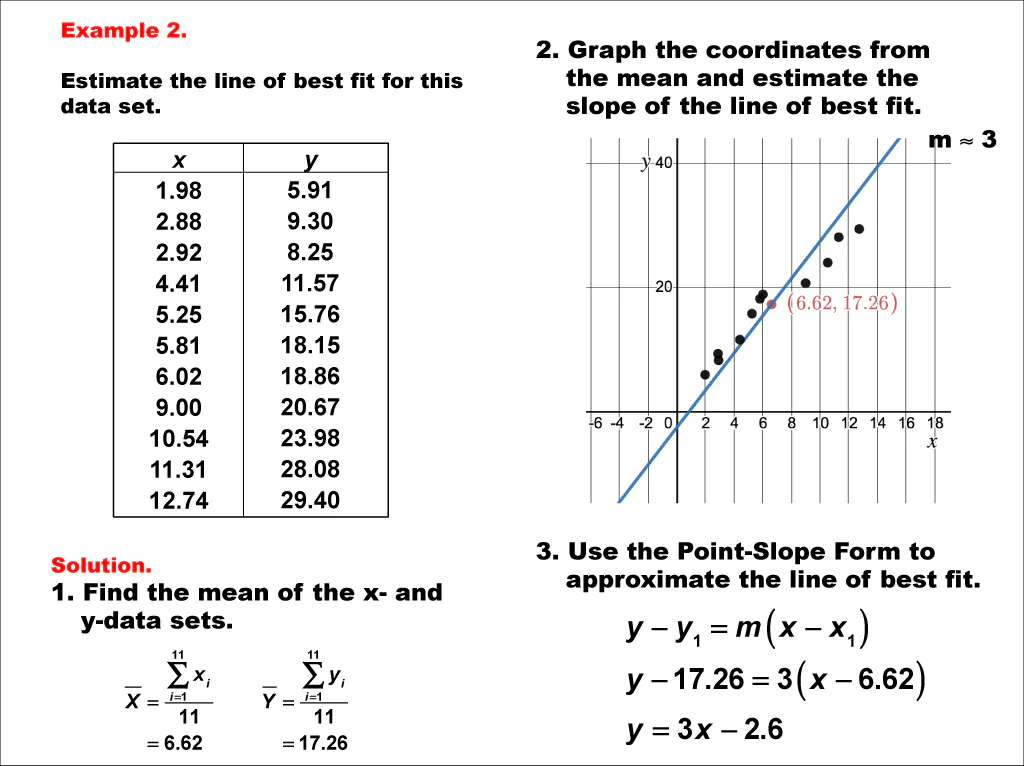
Line of Best Fit quizzes for Grade 10 students provide comprehensive assessment opportunities that strengthen understanding of this fundamental concept in probability and statistics. These teacher-created resources available through Wayground offer targeted practice questions that help students master the skills of creating scatter plots, analyzing data relationships, and drawing accurate trend lines through data points. The quizzes focus on developing critical mathematical reasoning as students learn to interpret correlation strength, make predictions based on linear models, and understand the difference between correlation and causation. Through immediate feedback and varied question formats, students build confidence in calculating correlation coefficients, determining equations of best-fit lines, and applying these statistical tools to real-world data analysis scenarios. Wayground supports mathematics educators with millions of teacher-created quiz resources specifically designed for probability and statistics instruction at the Grade 10 level. The platform's robust search and filtering capabilities enable teachers to quickly locate quizzes aligned with curriculum standards and specific learning objectives for line of best fit concepts. Educators can customize existing assessments or create differentiated versions to meet diverse student needs, from foundational skill reinforcement to advanced statistical analysis challenges. The flexible digital delivery format allows teachers to assign quizzes for independent practice, use them as formative assessments during instruction, or deploy them for targeted remediation and enrichment activities. These comprehensive tools streamline lesson planning while providing educators with detailed analytics to identify learning gaps and guide instructional decisions in statistical reasoning and data analysis skills.
FAQs
How do I teach line of best fit to Grade 10 students?
Begin with scatter plots students can describe as positive, negative, or showing little correlation. Have them sketch a line through the center of the data, check whether points are reasonably balanced above and below it, and then interpret the slope and intercept in context before introducing least-squares regression.
What exercises help Grade 10 students practice lines of best fit?
Use a progression of three tasks: classify correlation from scatter plots, construct or calculate a best-fit line, and use its equation to make a prediction. Real data sets are especially useful because students must explain what the prediction means instead of only substituting values.
What mistakes do students make when working with lines of best fit?
Students often connect individual points, force the line through the origin, or draw a line that follows an outlier rather than the overall trend. They may also treat correlation as proof of causation or make predictions far beyond the observed data without questioning reliability.
How can I use these Grade 10 line-of-best-fit quizzes?
Wayground quizzes are available as printable PDFs and digital formats for different teaching environments and student preferences. Host one as a digital quiz or assign the PDF on paper, then scan student submissions for grading with the Wayground for Teachers app. Every quiz includes a complete answer key.
How does line of best fit fit into the Common Core math progression?
Common Core places this work within modeling relationships between two quantitative variables. Students build from reading scatter plots and describing association toward fitting a linear model, interpreting its slope and intercept in context, and judging whether predictions are reasonable.
How can I differentiate line-of-best-fit practice for a mixed-ability class?
Give students who struggle with dense graphs a quiz version with larger type or wider spacing, while advanced students analyze outliers or compare graphical estimates with least-squares models. In digital sessions, extended time can support students who need longer to calculate and interpret regression equations.
What grade do students learn about lines of best fit?
Lines of best fit are commonly taught in high school statistics and algebra courses; this collection targets Grade 10. At this level, students connect scatter-plot patterns to linear equations and use those equations for contextual predictions.

Accessibility
Features
Wayground Super
School & District
Wayground for Business
Create a quiz
Create a presentation
Wayground AI
Subjects
Mathematics
Social Studies
Science
Physics
Chemistry
Biology
About
Our Story
Wayground Blog
Media Kit
Careers
Support
F.A.Q.
Help & Support
Privacy Policy
Terms of Service
Teacher Resources
2026 Wayground


Get our app

