
Resource Type


8th Grade Population and Sample Quizzes
Test your understanding of population and sample concepts with this Grade 8 mathematics quiz designed to assess your knowledge through practice questions and instant feedback. Challenge yourself with self-paced assessment problems that help reinforce key statistical principles and improve your analytical skills.

10 questions
Population and Sample

Quiz
•
8th Grade
10 questions
Population and Sample
Quiz
•
8th Grade
10 questions
Identify Population and Sample
Quiz
•
8th Grade

20 questions
Population and sample
Quiz
•
8th Grade

10 questions
Population and Samples
Quiz
•
8th Grade

15 questions
Population and sample
Quiz
•
8th Grade
15 questions
Populations, Samples, and Inferences Test
Quiz
•
8th Grade
12 questions
Population and Sample
Quiz
•
6th - 8th Grade
24 questions
Population and Sample
Quiz
•
6th - 8th Grade
12 questions
Population and Sample
Quiz
•
6th - 8th Grade
12 questions
Population and Samples
Quiz
•
6th - 8th Grade
8 questions
Sample Space and Likelihood
Quiz
•
6th - 8th Grade
Explore 8th Grade Population and Sample Quizzes
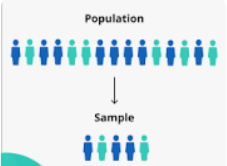
Population and sample concepts form a critical foundation in Grade 8 mathematics, helping students distinguish between entire groups and representative subsets used in statistical analysis. Wayground's comprehensive quiz collection provides targeted assessment opportunities that develop students' understanding of when and why researchers collect data from samples rather than entire populations. These practice questions guide learners through real-world scenarios where they must identify populations, determine appropriate sample sizes, and recognize potential sampling methods, building essential statistical reasoning skills. The quizzes offer immediate feedback that reinforces key terminology and helps students master the relationship between populations and the samples drawn from them. Wayground's platform empowers teachers with access to millions of educator-created quiz resources specifically designed to strengthen student comprehension of population and sample relationships. The robust search and filtering system enables instructors to quickly locate assessments aligned with Grade 8 mathematics standards, while customization tools allow for differentiation based on individual student needs. Teachers can deploy these digital quizzes in various formats, from whole-class review sessions to individual practice assignments, supporting both remediation for struggling learners and enrichment for advanced students. The platform's flexibility facilitates seamless integration into lesson planning, enabling educators to reinforce statistical concepts through targeted skill practice that adapts to diverse learning environments and instructional goals.
FAQs
What are the expectations for 8th graders regarding population and sample?
By 8th grade, students should be comfortable with the concepts from 7th grade. The focus often shifts to applying these ideas within new contexts, such as investigating patterns of association in bivariate data. For example, they might analyze a sample to see if there is a connection between hours spent studying and test scores for a whole population of students.
How can I connect sampling concepts to other 8th-grade math topics?
A great connection is with scatter plots. Have students collect sample data on two variables, such as height and arm span, from a sample of classmates. They can then create a scatter plot to see if the association in their sample might represent a pattern in the larger population of all 8th graders.
What kind of practice problems are appropriate for 8th graders on this topic?
Eighth-grade problems should involve more interpretation. Present students with a graph or data table from a sample and ask them to describe the patterns they see. Then, ask them to consider whether they can generalize that pattern to the larger population and what potential issues, like sampling bias, might affect their conclusion.
What's a key skill to assess for 8th graders with population and sample?
Assess their ability to critique a statistical study. Give them a short description of a study, including its research question, population, and sampling method. Ask them to identify potential sources of bias and explain why the conclusions might be weak or strong. This moves beyond calculation to critical statistical thinking.
How can I use this 8th-grade quiz for practice or review?
These quizzes are ready to use as printable PDFs or as interactive digital assignments on the Wayground platform. Each quiz comes with a complete answer key. The digital version is great for homework with instant feedback, while the printable PDF is perfect for in-class group work or for students who benefit from offline activities.
How does this topic fit within the 8th-grade Common Core standards?
While 7th grade introduces sampling and inference, 8th grade, according to Common Core, focuses heavily on investigating patterns of association in bivariate data. Understanding population and sample is foundational for this, as students learn that patterns observed in a sample's scatter plot can be used to make informal inferences about the association in the larger population.

Accessibility
Features
Wayground Super
School & District
Wayground for Business
Create a quiz
Create a presentation
Wayground AI
Subjects
Mathematics
Social Studies
Science
Physics
Chemistry
Biology
About
Our Story
Wayground Blog
Media Kit
Careers
Support
F.A.Q.
Help & Support
Privacy Policy
Terms of Service
Teacher Resources
2026 Wayground


Get our app

