


Slope from Table Quizzes
Master slope calculations from data tables with our comprehensive collection of slope from table quizzes on Wayground. Practice identifying rise over run using coordinate pairs and assess your understanding of linear relationships through self-paced questions with instant feedback.

20 questions
Determining Slope from Tables and Graphs

Quiz
•
8th Grade
20 questions
Find Slope from Tables and Graphs and Two Points
Quiz
•
8th Grade

20 questions
Slope from Tables and Points
Quiz
•
8th Grade

20 questions
Slope from Table, Graphs, Equation
Quiz
•
8th Grade

15 questions
Finding the Slope from Table, Graphs and Ordered Pair
Quiz
•
8th Grade

20 questions
Slope from Tables, Graph and Situations
Quiz
•
8th Grade
20 questions
Slope from Table and Points
Quiz
•
8th Grade
20 questions
Slope from Table and Graphs
Quiz
•
8th Grade
20 questions
Slope from Tables and Graphs and Two Points
Quiz
•
8th Grade
20 questions
Finding Slope from Table and Graph
Quiz
•
8th Grade
20 questions
Find Slope from Tables and Graphs
Quiz
•
8th Grade
11 questions
Slope from Tables Graphs and Equations
Quiz
•
8th Grade
Explore Slope from Table Quizzes
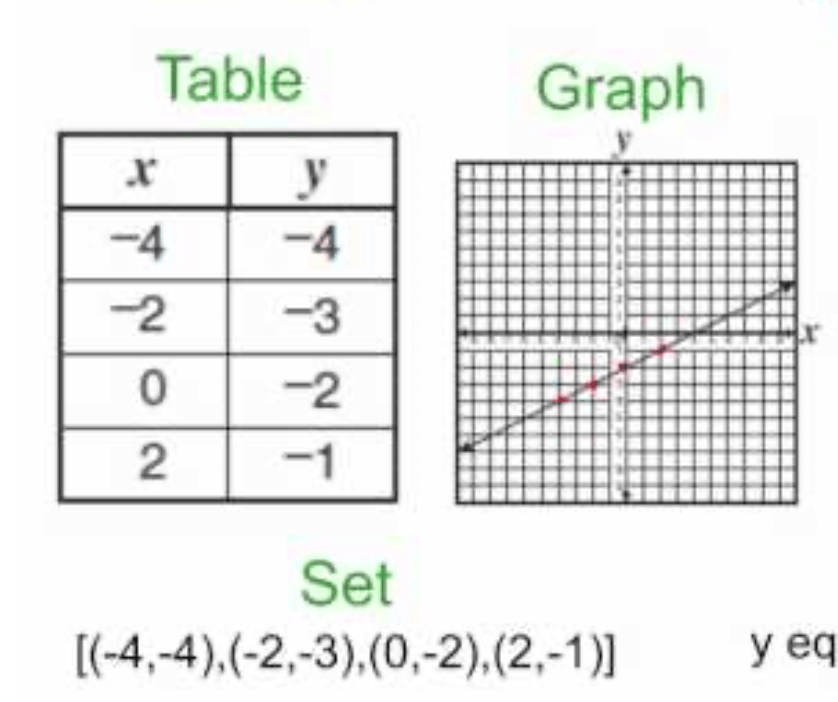
Slope from table problems represent a fundamental concept in linear equations that challenges students to identify and calculate the rate of change between two variables using organized data sets. These quizzes available through Wayground help students master the essential skill of determining slope by examining coordinate pairs presented in tabular format, developing their understanding of how consistent changes in x-values correspond to changes in y-values. Through targeted practice questions, students learn to apply the slope formula systematically, recognize patterns in data relationships, and build confidence in analyzing linear relationships. The assessment format provides immediate feedback that reinforces correct calculation methods while identifying common misconceptions about rise over run calculations and sign interpretation. Wayground supports mathematics educators with access to millions of teacher-created quiz collections focused on slope calculations and linear equation concepts, offering robust search capabilities that allow instructors to locate resources aligned with specific curriculum standards and learning objectives. Teachers can customize existing quizzes or create new assessments that address varying skill levels within their classrooms, incorporating differentiation strategies that support both remediation for struggling learners and enrichment opportunities for advanced students. The platform's flexible delivery options enable seamless integration into digital learning environments while maintaining printable alternatives when needed, facilitating effective lesson planning that reinforces slope concepts through varied practice opportunities. These comprehensive tools support ongoing skill development by providing educators with data-driven insights into student progress and areas requiring additional instructional focus.
FAQs
How do I teach students to find slope from a table?
Start by defining slope as the 'rate of change.' Use the table to show that for every consistent change in x, there is a corresponding consistent change in y. Guide students to pick any two points (x₁, y₁) and (x₂, y₂) from the table and apply the formula m = (y₂ - y₁) / (x₂ - x₁). Emphasize that the result will be the same no matter which two points they choose.
What exercises help students practice calculating slope from a table?
Effective practice involves quizzes with a variety of tables. Start with tables containing simple, positive integers and consecutive x-values. Then, progress to problems with non-consecutive x-values, negative integers, and rational numbers (fractions and decimals). This builds both procedural fluency and a deeper conceptual understanding.
What are common mistakes students make when finding slope from a table?
A frequent error is reversing the slope formula, calculating 'run over rise' (Δx/Δy) instead of 'rise over run' (Δy/Δx). Students also commonly make sign errors when subtracting negative numbers or mix up the x and y values from their chosen coordinate pairs.
How can I use this slope from table quiz?
This resource is flexible for any classroom. You can assign it as a digital quiz on the Wayground platform or download it as a printable PDF for offline practice. Every quiz includes a complete answer key, and for paper assignments, you can use the Wayground for Teachers app to quickly scan and grade student work.
How does finding slope from a table fit into the math curriculum?
Aligned with Common Core, this skill builds directly on students' prior knowledge of ratios and unit rates from middle school. Mastering slope calculation from a table is a critical prerequisite for the 8th-grade and Algebra 1 task of writing linear equations in the form y = mx + b.
How can I differentiate this topic for diverse learners?
For students needing support, use tables with pre-highlighted pairs of points to focus their attention. You can also use Wayground's digital accommodation tools like 'Read Aloud' for word problems or 'Reduced answer choices' to lower cognitive load. For enrichment, challenge students with tables that have missing values they must find using a given slope.

Accessibility
Features
Wayground Super
School & District
Wayground for Business
Create a quiz
Create a presentation
Wayground AI
Subjects
Mathematics
Social Studies
Science
Physics
Chemistry
Biology
About
Our Story
Wayground Blog
Media Kit
Careers
Support
F.A.Q.
Help & Support
Privacy Policy
Terms of Service
Teacher Resources
2026 Wayground


Get our app

