Filters
Resource Type

10th Grade Statistics Presentations
This Grade 10 Statistics presentation provides structured instruction through comprehensive lesson slides that explain key statistical concepts and data analysis methods. Visual learning materials guide students through statistical measures, data interpretation, and graphing techniques essential for understanding statistical relationships.
Recommended topics for you

15 questions
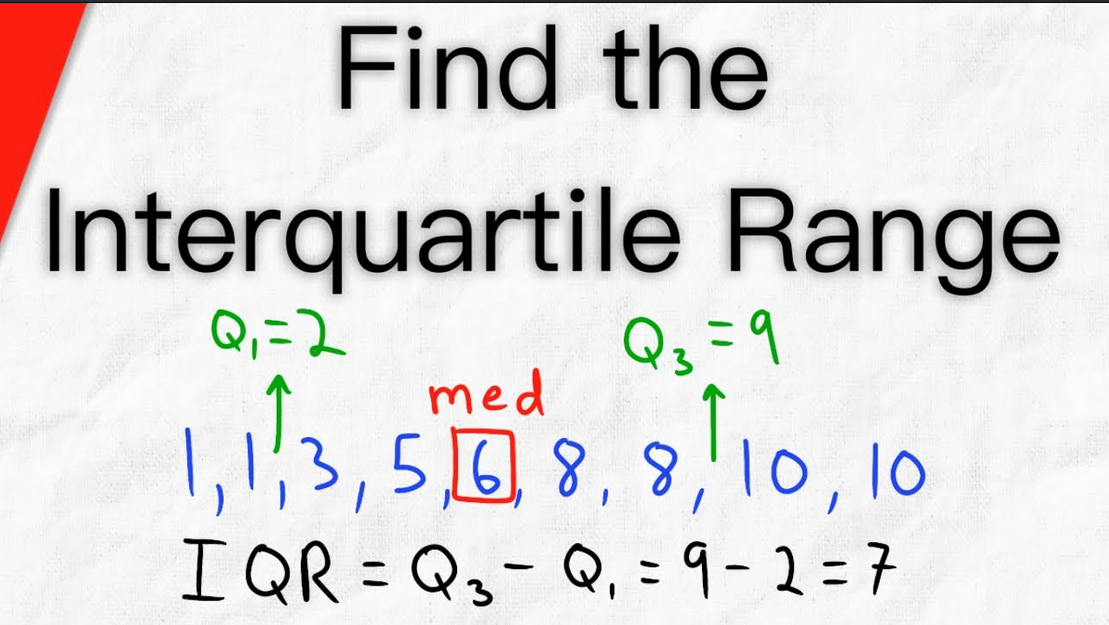
Introduction to Interquartile Range
Presentation
•
10th Grade
25 questions
Measures of Spread; Range and Interquartile Range
Presentation
•
10th Grade

16 questions
Statistics Quiz Review
Presentation
•
9th - 12th Grade

17 questions
Lesson 1.1 The Language of Statistics
Presentation
•
9th Grade

16 questions
Introduction to Statistics
Presentation
•
8th - 12th Grade

16 questions
Unit 9 Statistics Vocabulary
Presentation
•
9th - 12th Grade
68 questions
One Variable Statistics
Presentation
•
9th - 12th Grade
18 questions
Basic Statistics - AFDA
Presentation
•
8th - 12th Grade
26 questions
statistics - 1: collecting and organising data
Presentation
•
9th Grade
27 questions
Introduction to Statistics
Presentation
•
7th - 10th Grade
44 questions
Day 3 Statistics & Piecewise Functions
Presentation
•
9th Grade
21 questions
4.13 Statistics Review 3 (A2)
Presentation
•
10th - 12th Grade
Explore 10th Grade Statistics Presentations
Statistics presentations for Grade 10 mathematics provide comprehensive resources that break down complex statistical concepts through structured instruction and visual learning approaches. These educational materials available through Wayground (formerly Quizizz) focus on developing students' analytical thinking skills by presenting statistical methods, data interpretation techniques, and probability concepts in clear, digestible segments. The presentations emphasize concept explanation through systematic coverage of measures of central tendency, data distribution patterns, sampling methods, and statistical inference, helping students build a solid foundation in statistical reasoning that supports both academic success and real-world application. Wayground (formerly Quizizz) empowers educators with access to millions of teacher-created statistics presentations that can be easily discovered through robust search and filtering capabilities, allowing instructors to locate materials that align with specific curriculum standards and learning objectives. The platform's differentiation and customization tools enable teachers to modify presentations to meet diverse student needs, supporting both remediation for struggling learners and enrichment opportunities for advanced students. These digital-first resources offer flexible delivery formats that accommodate various classroom configurations and learning environments, while comprehensive planning tools help educators integrate statistical concepts seamlessly into their instruction, reinforcing key skills through repeated exposure and varied presentation styles that enhance long-term retention and conceptual understanding.
Accessibility
Features
Wayground Super
School & District
Wayground for Business
Create a quiz
Create a presentation
Wayground AI
Subjects
Mathematics
Social Studies
Science
Physics
Chemistry
Biology
About
Our Story
Wayground Blog
Media Kit
Careers
Support
F.A.Q.
Help & Support
Privacy Policy
Terms of Service
Teacher Resources
2026 Wayground


Get our app

