
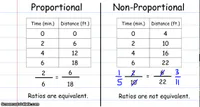
Proportional and Nonproportional Relationships Table

Flashcard
•
Mathematics
•
8th Grade
•
Practice Problem
•
Hard

Wayground Content
FREE Resource
Student preview

15 questions
Show all answers
1.
FLASHCARD QUESTION
Front
What is a proportional relationship?
Back
A proportional relationship is a relationship between two quantities where the ratio of one quantity to the other is constant.
2.
FLASHCARD QUESTION
Front
What is a non-proportional relationship?
Back
A non-proportional relationship is a relationship where the ratio of one quantity to another is not constant.
3.
FLASHCARD QUESTION
Front
How can you identify a proportional relationship in a table?
Back
If the ratios of corresponding values are the same, the relationship is proportional.
4.
FLASHCARD QUESTION
Front
What does it mean if a graph passes through the origin?
Back
If a graph passes through the origin (0,0), it indicates a proportional relationship.
5.
FLASHCARD QUESTION
Front
What is the equation of a proportional relationship?
Back
The equation of a proportional relationship can be expressed as y = kx, where k is a constant.
6.
FLASHCARD QUESTION
Front
What is the slope of a proportional relationship?
Back
The slope of a proportional relationship is equal to the constant of proportionality (k).
7.
FLASHCARD QUESTION
Front
What does a linear graph represent?
Back
A linear graph represents a constant rate of change between two variables.
Access all questions and much more by creating a free account
Create resources
Host any resource
Get auto-graded reports

Continue with Google

Continue with Email

Continue with Classlink

Continue with Clever
or continue with

Microsoft
%20(1).png)
Apple

Others
Already have an account?


