
Line Graphs
Presentation
•
Mathematics
•
4th Grade
•
Easy
•
CCSS
HSF.IF.B.4, 8.F.B.4, 8.EE.B.5
+1
Standards-aligned

Brittani Smith
Used 420+ times
FREE Resource
8 Slides • 8 Questions
1
Line Graphs

2

3

4
Open Ended
5
6
Multiple Choice

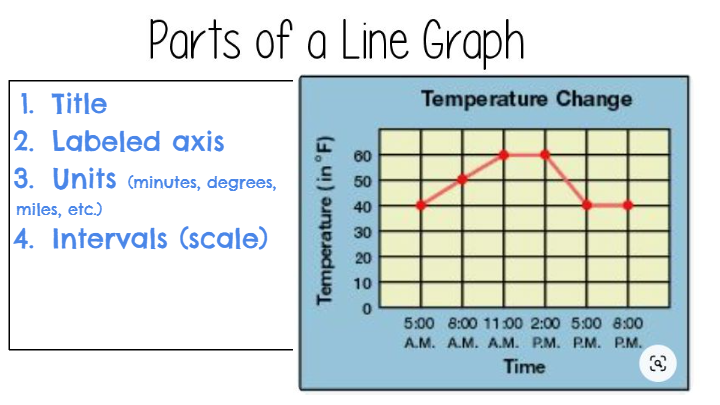
What is the title of this line graph?
7

8
Open Ended

What do you notice about this graph?
9

10
Open Ended

What do you notice about this graph?
11

12
Open Ended

What do you notice about this graph?
13

14
Multiple Choice

When the line is slanted this way it means the graph is....
15
Multiple Choice

When the line is slanted this way it means the graph is...
16
Multiple Choice

When the line looks like this it means the graph is...
Line Graphs
Show answer
Auto Play
Slide 1 / 16
SLIDE
